

Only 17% of marketing and advertising leaders were very satisfied with their media-attribution approach, according to Mastercard's media-measurement research. Access to campaign dashboards clearly doesn't guarantee confidence about what marketing achieves.
Marketing teams can be measured on almost everything while remaining accountable for very little. Clicks, enquiries and sales each describe something different. The discipline begins with choosing marketing key performance indicators that connect a defined objective to a decision someone can make.
A metric records an observation; a KPI establishes whether you're progressing towards an important objective. Website visits might help diagnose a campaign, but customer acquisition cost becomes more consequential when your objective is profitable growth.
The indicators below answer five strategic questions:
- Efficiency: What does acquiring customers cost, and what does advertising return? Use CAC and ROAS.
- Revenue quality: Are customer relationships and marketing investments commercially worthwhile? Use CLV and ROMI.
- Engagement: Does audience interest lead to meaningful action? Use conversion rate and CTR.
- Loyalty: Do customers recommend the organisation and remain with it? Use NPS and churn.
- Pipeline alignment: Are marketing enquiries suitable for sales follow-up? Use MQLs.
These aren't nine compulsory dashboard entries. Select complementary indicators that explain your objective, retain supporting metrics for diagnosis, and establish what action a disappointing result should trigger.
Table of Contents
- 1. Customer Acquisition Cost (CAC)
- 2. Customer Lifetime Value (CLV)
- 3. Return on Marketing Investment (ROMI)
- 4. Conversion Rate
- 5. Click-Through Rate (CTR)
- 6. Return on Ad Spend (ROAS)
- 7. Net Promoter Score (NPS)
- 8. Customer Churn Rate
- 9. Marketing Qualified Leads (MQLs)
- Nine Marketing Key Performance Indicators at a Glance
- Selecting the Right Indicators From Measurement to Action
1. Customer Acquisition Cost (CAC)
Customer Acquisition Cost measures the total sales and marketing expenditure required to acquire a new paying customer. It answers an efficiency question: how much must the organisation invest to grow its customer base?
CAC = total acquisition-related sales and marketing costs ÷ new customers acquired
Include creative production, agency fees, advertising expenditure, relevant software and attributable sales salaries. A calculation containing only media spend is narrower than a fully loaded CAC and should be labelled accordingly.

Compare like-for-like acquisition journeys
Say a subscription software company finds that display advertising has a higher CAC than paid search. Before transferring its budget, the marketing manager should establish whether display introduces prospects who later return through search. Otherwise, the organisation may reward demand capture while removing the activity that creates demand.
Distinguish acquisition from re-engagement, too. Email campaigns aimed at existing customers shouldn't be compared directly with campaigns recruiting entirely new buyers.
- Report by segment: Compare channels, campaigns and customer groups alongside the overall figure.
- Match the timing: Allow for the delay between marketing expenditure and a completed purchase.
- Assess value: Read CAC alongside gross-margin-based CLV and the time required to recover acquisition expenditure.
Review trends across consistent reporting periods rather than responding to isolated fluctuations. A lower CAC is useful only if the organisation still attracts customers whose purchases justify the investment.
2. Customer Lifetime Value (CLV)
A customer who buys once and a customer who returns regularly may look identical in an acquisition report. Customer Lifetime Value distinguishes their expected economic contribution over the relationship.
A straightforward revenue model is:
CLV = average order value × purchase frequency × expected customer lifespan
For commercial decisions, add a gross-margin adjustment or model expected customer contribution directly. State whether your calculation represents revenue, gross profit or a discounted estimate of future contribution, because these aren't interchangeable.

Use cohorts rather than an imagined average customer
Consider a meal-kit subscription business comparing customers acquired through discount advertising with those arriving through referrals. Discount-led customers might cancel after the introductory offer, while referred customers continue ordering. Their initial acquisition costs won't explain this difference, but cohort-level CLV can.
The marketing manager could then test onboarding messages, recipe recommendations or delivery reminders against subsequent retention and contribution. The objective isn't to stimulate another order; it's to improve the economics of the relationship.
Interpretation rule: A lifetime-value estimate is a forecast, not money already earned.
Keep observed customer contribution separate from predicted future value. Young cohorts require particular caution because their eventual lifespan remains uncertain.
Recalculate CLV when prices, margins, retention or product mix change. There's no universally appropriate CLV-to-CAC threshold: the acceptable relationship depends on cash availability, service costs, forecasting uncertainty and how quickly the organisation recovers its acquisition investment.
3. Return on Marketing Investment (ROMI)
Return on Marketing Investment evaluates the profit generated by marketing relative to its cost. It addresses revenue quality at investment level, helping managers distinguish commercially productive activity from activity that merely receives credit for sales.
ROMI = (incremental gross profit attributable to marketing − marketing expenditure) ÷ marketing expenditure × 100
Here, incremental gross profit means additional gross profit before deducting the marketing expenditure being evaluated. This definition avoids subtracting the same cost twice.

Estimate what happened because of marketing
A retailer could run a geographical holdout test, withholding a campaign from comparable locations. Analysts would compare outcomes while accounting for differences such as local promotions, stock availability and underlying demand. The resulting estimate concerns incremental performance, rather than every purchase recorded after an advertisement.
This distinction also applies to economic evidence. The UK government's Online Advertising Taskforce progress report states that every £1 spent on digital advertising delivered £4.80 in gross value added to the UK economy in 2022, an economy-wide measure rather than a company's marketing return.
Use a consistent profit definition and evaluation horizon. Short reporting windows can miss delayed purchases, while excessively broad windows make attribution harder.
Our explanation of analytics in marketing provides further context for connecting measurement with business decisions. Present ROMI alongside acquisition, customer-value and uncertainty measures so finance colleagues can assess both the estimated return and the assumptions supporting it.
4. Conversion Rate
An education provider may attract suitable visitors yet lose applicants during registration. Conversion rate measures the proportion of a defined audience that completes a specified action, such as submitting an enquiry, making a purchase or completing course registration.
Conversion rate = completed conversions ÷ relevant visitors or prospects × 100
The denominator determines what the rate describes. A visitor-to-enquiry rate measures a different stage from an application-to-enrolment rate, so define the audience and action before comparing results.
The LOCALiQ UK Paid Advertising Benchmark Report reported an average conversion rate of 3.65%, down 17.34% year on year, across its UK paid-advertising benchmark. Treat this figure as context, not as a target for every organisation.

Diagnose the stage before changing the campaign
If applicants leave during registration, the campaign may be attracting relevant visitors while the form or information presents an obstacle. The team could test clearer programme-duration information, simpler form fields and more explicit payment instructions.
- Segment the journey: Compare devices, traffic sources and landing pages.
- Inspect abandonment: Identify the specific step where prospective customers leave.
- Protect conversion quality: Track completed enrolments or purchases, not just form submissions.
Set experiments against a meaningful outcome and allow enough time to observe results. Checking incomplete results repeatedly can lead to premature decisions. The guide to search engine optimisation, traffic and conversions explores how attracting relevant visitors relates to helping them act. Assess traffic quality and the conversion journey separately, since each requires its own diagnosis.
5. Click-Through Rate (CTR)
An advertisement can attract attention without attracting suitable customers. Click-Through Rate measures response to a link or advertisement, not the commercial value of that response.
CTR = clicks ÷ impressions × 100
Because this calculation normally uses event counts, it isn't necessarily the percentage of individual people who clicked. For email, specify whether the platform reports unique clickers against delivered messages, total clicks, or another denominator.
Treat relevance as a hypothesis to test
A retailer testing search-advertisement headlines might find that a promotional headline attracts more clicks than a product-specific alternative. If those additional visitors rarely buy, the headline may have created an expectation the landing page doesn't fulfil.
An education marketing team could similarly personalise email content by programme interest. Evaluate the message link and call to action through CTR, while assessing subject-line performance separately; don't assume every change in email clicks came from the subject line.
More clicks are useful only when the additional visitors help achieve the campaign's objective.
Use comparable historical campaigns as your starting point. Search advertisements, display placements and email messages reach audiences in different circumstances, so a blended average can conceal more than it explains.
Test a clearly defined creative variable, inspect suspicious click patterns and compare downstream conversion quality. If CTR rises while qualified enquiries decline, review targeting and message-to-page consistency before increasing expenditure. CTR is particularly useful as an early diagnostic indicator, but it rarely deserves sole responsibility for a revenue objective.
6. Return on Ad Spend (ROAS)
A high return on ad spend can still leave a campaign unprofitable. ROAS measures advertising-attributed revenue relative to advertising expenditure:
ROAS = advertising-attributed revenue ÷ advertising expenditure
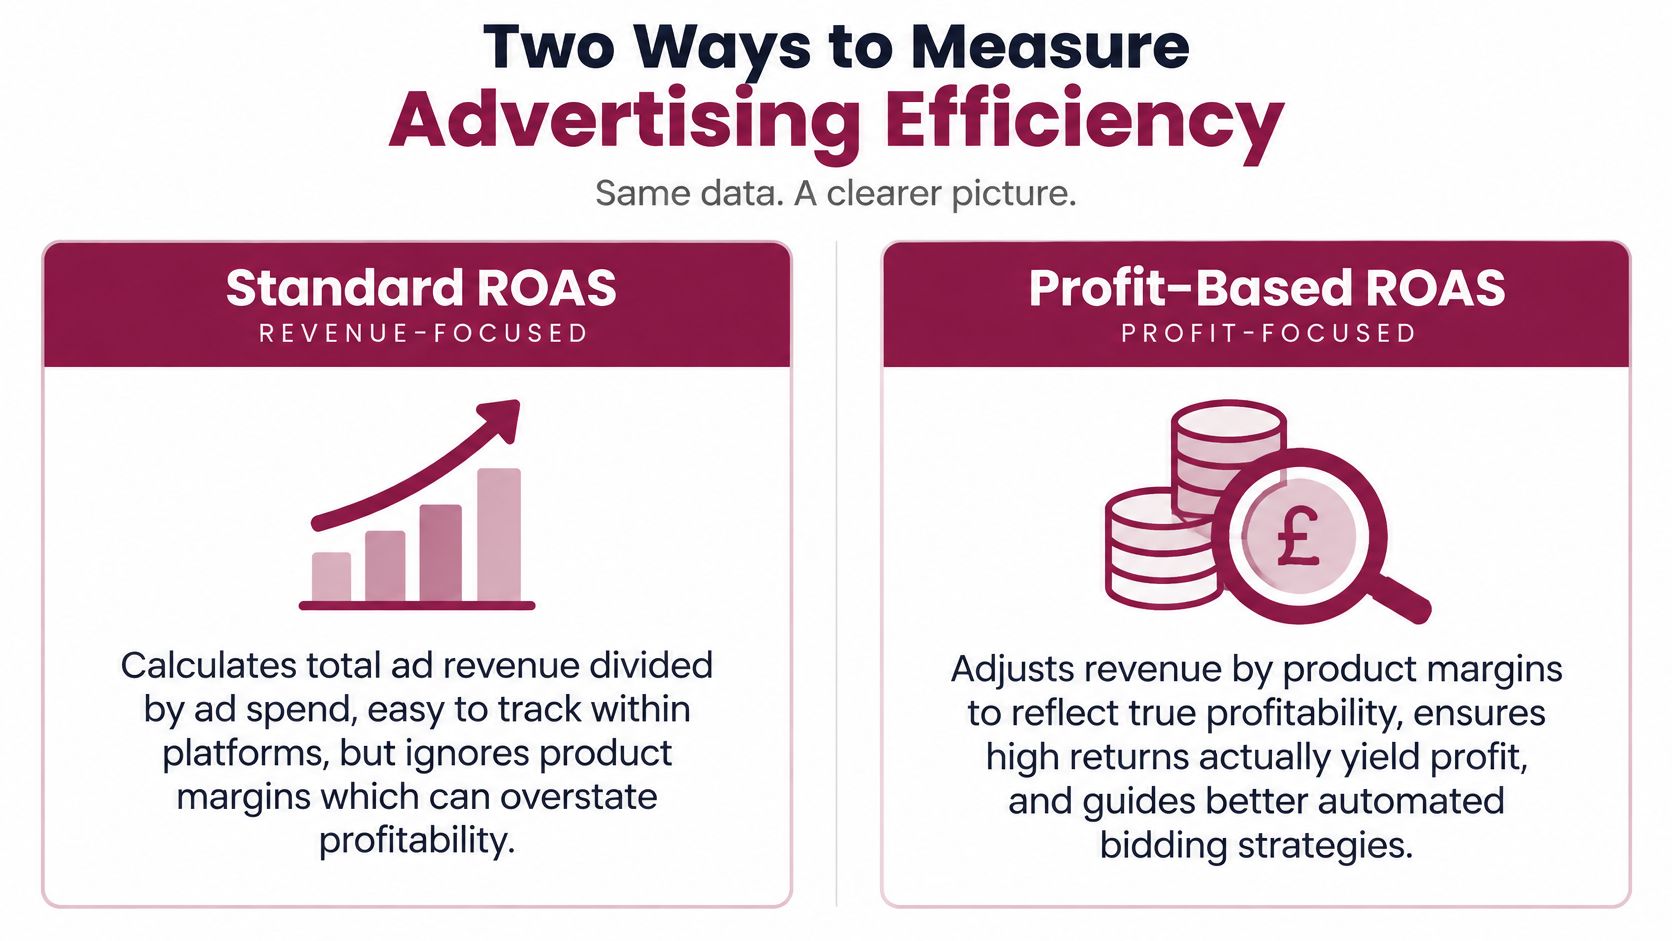
For example, a campaign generating £4 in attributed revenue for every £1 spent on advertising has a ROAS of 4:1. The ratio helps compare paid campaigns when attribution rules, conversion windows and revenue definitions are consistent. It does not account for product costs, fulfilment, overheads or acquisition expenses beyond advertising.
Reconcile platform credit with business records
A clothing retailer's retargeting campaign can show strong ROAS and still leave little contribution. Discounts, returns and narrow product margins reduce the revenue available after costs. Compare platform-attributed figures with net revenue and contribution, and label a profit-based calculation separately from standard ROAS.
Campaigns also differ in their role. Separate branded search from generic prospecting rather than treating them as equivalent: a UK B2B benchmark published by C M Beyer reports branded PPC conversion at 6.2%, compared with 2.2% for generic PPC.
- Set economically informed targets: Account for margins, returns and customer value.
- Keep attribution consistent: Use the same conversion windows and revenue definitions when comparing campaigns.
- Check recorded revenue: Reconcile advertising-platform figures with CRM and finance records.
Where possible, report observed and modelled conversions separately. Automated bidding can optimise towards a ROAS target, but the target is only meaningful when the revenue definition reflects the business objective. It cannot establish whether an attributed purchase would have happened without the advertisement.
7. Net Promoter Score (NPS)
Net Promoter Score summarises customers' stated willingness to recommend an organisation, product or service. Respondents answer a recommendation question on a scale from zero to ten.
Under the standard classification, promoters score nine or ten, passives seven or eight, and detractors zero to six. NPS equals the percentage of promoters minus the percentage of detractors. Passives remain in the response base but aren't directly added or subtracted.
NPS answers a question about expressed advocacy. It provides a view of customer sentiment, while repeat purchases, referrals and profitability require separate measures.
Ask what explains the recommendation
After course completion, a professional education provider asks learners whether they would recommend the course. An open-ended follow-up can reveal why: satisfied learners may value clear explanations, while dissatisfied learners may have struggled to complete assessments.
Investigate those experiences before chasing a higher headline score. Customer experience mapping can organise feedback around the touchpoints that shaped respondents' judgements.
- Choose meaningful moments: Keep survey timing consistent within comparable cohorts.
- Examine participation: Consider whose experience is missing from the responses.
- Close the loop: Contact dissatisfied customers appropriately and communicate relevant improvements.
A small score movement deserves careful interpretation. Changes in respondent mix, survey timing or participation can affect the result, so avoid treating a shift as proof that a campaign or service change worked.
Pair NPS with qualitative feedback to understand the reasons behind responses. This helps managers identify specific experiences to improve and interpret advocacy alongside other indicators of customer behaviour.
8. Customer Churn Rate
A subscription business can recruit customers successfully while losing existing customers quickly enough to undermine its growth. Customer churn rate measures the proportion of the starting customer base that leaves during a defined period.
Customer churn rate = customers lost from the opening customer base ÷ customers at the start of the period × 100
Define what counts as leaving. Cancellation, non-renewal and inactivity aren't necessarily equivalent, particularly when customers purchase irregularly rather than subscribe.
Distinguish dissatisfaction from payment failure
For a subscription learning platform, declining participation might justify supportive reminders or clearer onboarding. A failed renewal payment calls for a different response, such as a payment reminder and a straightforward way to update card details.
These interventions address different causes. Combining voluntary cancellations and involuntary payment failures into an unexplained total makes it harder to choose the right action.
Operational distinction: Customer churn measures lost relationships; revenue churn measures lost recurring revenue. Report them separately when customer spending varies.
Segment results by acquisition cohort, subscription plan and engagement pattern. Then connect the findings to acquisition decisions: a channel that attracts inexpensive customers may still deliver weak value if those customers leave quickly.
Use leading indicators carefully. Reduced usage can identify customers who may need help, but it doesn't prove that they intend to cancel.
For non-subscription businesses, consider whether repeat-purchase rate or time between purchases offers a clearer picture of retention. A learner who completes a standalone course successfully hasn't necessarily churned because they don't enrol immediately in another.
9. Marketing Qualified Leads (MQLs)
Marketing Qualified Leads are prospects who meet agreed criteria indicating both suitability and sufficient engagement for a defined next step. The basic measure is the number of leads crossing that threshold during the reporting period.
MQLs answer a pipeline-alignment question: is marketing generating enquiries that sales or admissions colleagues can use? Engagement alone is insufficient; someone who repeatedly reads a blog may have no relevant need, purchasing authority or intention to proceed.
Define qualification jointly
A business school might classify a prospect as marketing qualified after they request a brochure, attend a relevant webinar and meet the programme's suitability criteria. Admissions colleagues should help define that threshold and explain why they accept or reject the resulting enquiries.
Record these stages in a CRM such as HubSpot or Salesforce, using consistent status definitions. Avoid changing qualification rules without documenting the change, because apparent growth may reflect a looser threshold.
- Track acceptance: Measure whether sales or admissions accepts the leads passed across.
- Validate outcomes: Compare qualification signals with eventual purchases or enrolments.
- Retain a nurture route: Offer relevant information to prospects who aren't ready for direct follow-up.
Cost should also reflect the stage achieved. UK government campaign-evaluation guidance distinguishes cost per expression of interest from cost per completed registration or application.
A growing MQL count isn't automatically progress. If acceptance and enrolment decline, review targeting, scoring and follow-up rather than rewarding volume. The strongest definition is one that colleagues can apply consistently and validate against downstream outcomes.
Nine Marketing Key Performance Indicators at a Glance
A useful KPI table should help answer a strategic question, not merely define each metric. The nine indicators below are grouped by the decisions they support: improving efficiency, assessing revenue quality, understanding engagement, monitoring loyalty and aligning the pipeline.
| Indicator | Strategic Question | Best Suited To | Key Limitation |
|---|---|---|---|
| Customer Acquisition Cost (CAC) | Efficiency: What does it cost to acquire a customer? | Comparing acquisition efficiency across channels or segments | Attribution and timing issues can distort results |
| Return on Marketing Investment (ROMI) | Efficiency: Does marketing investment generate incremental profit? | Evaluating and allocating marketing budgets | Isolating marketing's incremental impact is difficult |
| Customer Lifetime Value (CLV) | Revenue quality: What value is expected from a customer over the relationship? | Guiding acquisition, retention and customer-segment investment | Forecasts depend on uncertain assumptions |
| Return on Ad Spend (ROAS) | Revenue quality: How much attributed revenue does advertising generate for each unit of spend? | Comparing and optimising paid advertising performance | It ignores margins and costs beyond advertising |
| Click-Through Rate (CTR) | Engagement: How often do impressions lead to clicks? | Evaluating the relevance of ads, links and calls to action | Clicks do not guarantee conversions or revenue |
| Conversion Rate | Engagement: How often do visitors or prospects complete the desired action? | Assessing website, offer or campaign effectiveness | It does not reflect the value or quality of conversions |
| Net Promoter Score (NPS) | Loyalty: How willing are customers to recommend the organisation, product or service? | Tracking advocacy and loyalty over time | A single score does not explain the reasons behind responses |
| Customer Churn Rate | Loyalty: How much of the customer base is lost over a period? | Monitoring retention and forecasting recurring revenue | It does not explain why customers leave |
| Marketing Qualified Leads (MQLs) | Pipeline alignment: Are marketing and sales applying a shared threshold to identify promising leads? | Aligning marketing and sales and assessing lead quality | Qualification rules must be validated against enrolments before the count is trusted |
Selecting the Right Indicators From Measurement to Action
A useful marketing dashboard starts with a clear objective. Define the intended outcome in practical terms, such as acquiring commercially suitable customers, improving registration completion or reducing avoidable subscription cancellations. Then select indicators that show progress and help explain what may be affecting it.
Keep the executive view focused. The Government Digital Service performance framework recommends approximately five top-line KPIs for most services. Separate these headline measures from the diagnostic detail teams use to investigate performance.
Build a small, complementary set
Select indicators according to the strategic question at hand: efficiency asks what it costs to acquire customers; revenue quality asks whether marketing generates valuable returns; engagement examines responses to content and campaigns; loyalty considers advocacy and retention; and pipeline alignment assesses whether marketing-qualified prospects progress towards customer outcomes. Together, these questions provide a useful frame for choosing measures without reporting every available metric.
For each KPI, agree its owner, definition, reporting period and the action it may prompt. Record the data source, attribution assumptions and exclusions in a shared measurement dictionary. This gives colleagues a common basis for interpreting the figures.
Make uncertainty and safeguards visible
Present estimates as estimates. Reconcile campaign records with collected revenue, explain material gaps and distinguish observed outcomes from projections. Use controlled tests for consequential decisions where feasible.
Apply the same discipline to AI-assisted marketing. Production speed and cost per approved asset indicate efficiency; qualified enquiries, enrolments and retention show whether that work is achieving useful outcomes. Include human review, factual accuracy and customer complaints in the assessment, rather than rewarding output volume alone.
Accurate, lawful and honest marketing supports effective performance. UK government advertising and marketing guidance sets out relevant requirements, including compliance with data-protection rules when organisations collect, store or use customer information.
Professionals seeking structured development can explore the CPD-accredited, self-paced programmes at London School of Business Administration. Its Marketing Strategy course, taught by Chartered Marketer Jenna Tiffany, covers setting objectives, selecting channels, implementing campaigns, measuring performance and evaluating outcomes.
Start with one objective, define indicators that answer distinct strategic questions, and agree how the evidence will inform decisions.