

Someone in your team asks a question that should be simple: where does a customer's refund go once the form is submitted? Three people give three answers. One says finance checks it. Another says the platform approves small amounts automatically. A third remembers a spreadsheet that someone maintains. Nobody can say how long the whole thing takes, and nobody can name the owner of the step where the case is currently sitting.
That gap between how work is described and how work is done is why business process models exist. Not to produce a tidy diagram for a slide deck, but to make a route visible enough that you can time it, staff it, find where it stalls and judge whether it's safe to automate. A model that can't answer those questions is decoration.
The useful version is smaller and more concrete than most guides suggest. It has five parts, a handful of symbols, one owner per step and a set of measures attached to the whole route. Get those right and you can walk into a room, draw the process in twenty minutes and leave with a decision about what to fix first.
Table of Contents
- What a Business Process Model Shows
- BPMN Symbols and What Each One Means
- Choosing a Notation for Your Purpose
- How to Build a Business Process Model Step by Step
- Worked Examples From Public Statistics to Enrolment
- Using Models to Find Bottlenecks Before Automating
- Map One Process This Week
What a Business Process Model Shows
A customer asks for their money back. Before anyone touches the case, three questions need answers: who checks the claim, what decides the outcome, and when the customer gets paid. Those three questions describe a process, even if nobody has written it down.
A business process model is a structured picture of how work moves through an organisation. It shows which activities happen, who performs them, in what order, which decisions change the route, and what information or material passes between steps. Think of a city map. A single street tells you where to turn next; only the map shows how every route connects, where the one-way systems are and which junction causes the queue.
The five elements a model must contain
The UK Government's guide to governance and management frameworks states that a process must contain an input, a transforming activity, an output, the resources required to undertake the activity and performance metrics. That's a stricter test than most diagrams pass, and it's the reason a model can support a decision while a flowchart can only describe one.
Apply it to the refund. The claim form is the input. Checking eligibility is the transforming activity. An approved refund and a written decision to the customer are the outputs. A finance officer plus the payments system are the resources. Days from claim to payment is the metric. Remove the metric and you're left with a picture that records work but can't help you decide whether to change it.
The same guidance goes further, noting that clearly defined processes support effective decision-making, allow risk-based controls to be applied consistently, and link guidance, procedures, templates and tools to the point where a person needs them. It also advises that models spanning several departments should join up across the wider system and stay consistent, which is the practical argument for one common workflow tool across functions.
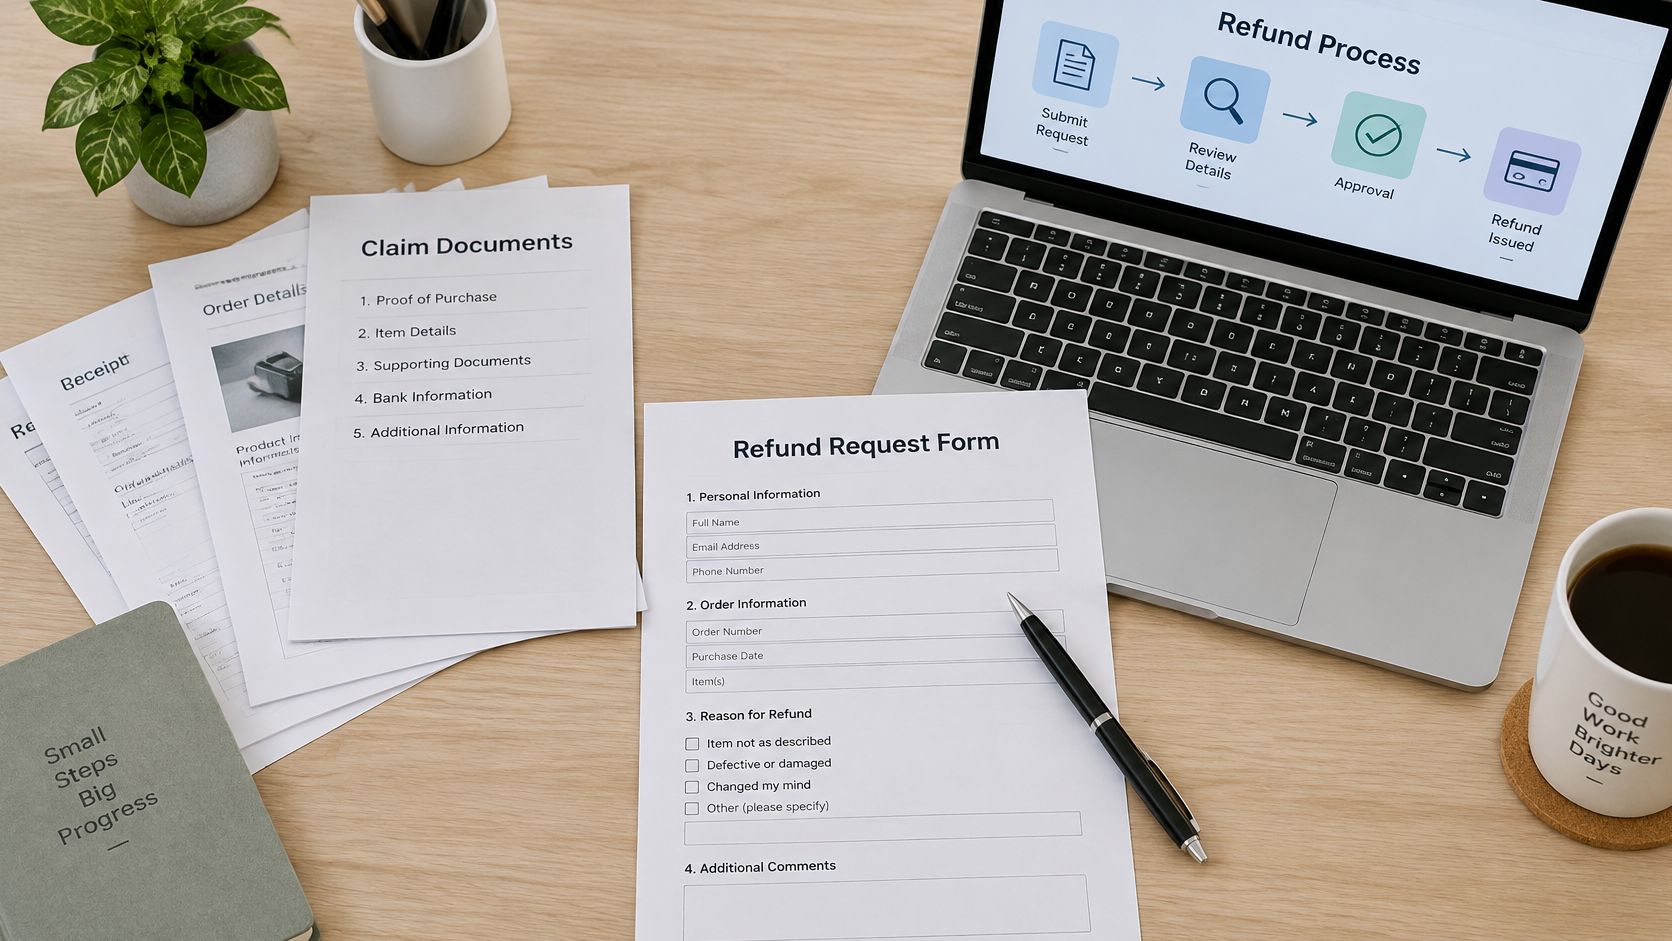
The test for any model: for every activity, point to the input, the transforming activity, the output, the enabling resource and the metric. If one is missing, the model is incomplete, and anything built on top of it will inherit the gap.
BPMN Symbols and What Each One Means
Business Process Model and Notation (BPMN) is the most widely used standard for drawing processes. Its value isn't aesthetic. It's that two people who have never met can read the same diagram and see the same thing, which is rarely true of a whiteboard sketch photographed at the end of a workshop.
The symbols you'll use most
Ten elements cover the overwhelming majority of first models. Learn these before reaching for anything more exotic.
| Element | Shape | Meaning | Example |
|---|---|---|---|
| Start event | Thin circle | Where the process begins | Learner submits a refund request |
| End event | Thick circle | Where a path finishes | Refund paid or claim rejected |
| Task | Rounded rectangle | One unit of work | Check eligibility |
| Gateway | Diamond | Decision or split in the flow | Amount above threshold? |
| Sequence flow | Solid arrow | Order in which work happens | Eligibility check, then approval |
| Message flow | Dashed arrow | Communication between pools | Request sent to finance provider |
| Pool | Large rectangle | A participant or organisation | Customer, company, finance provider |
| Lane | Horizontal band within a pool | A role or department | Finance officer |
| Data object | Page icon | A document or record used or produced | Claim form |
| Timer event | Clock icon | A waiting period | Five-day response deadline |
How to read a diagram without training
Start at the thin circle and follow one solid arrow at a time. At every diamond, check that each outgoing arrow carries a label naming its condition; without those labels the reader has to guess whether approval and rejection are the only two possible outcomes. Then confirm each task sits in the lane of the role that performs it, not the role that asked for it.
Next, check the stopping conditions. Every path should finish at a thick circle. A path that runs off the page, or loops back to a task with no exit, is the most common defect in a first draft, and it usually reflects something real: work that has no defined ending in the organisation, which is exactly where cases go to disappear.
The slip that catches most newcomers is drawing a task where a decision belongs. "Approve refund" isn't a task; it's a gateway with two labelled paths and a task on each. Split it that way and the model starts answering the questions that matter, namely who decides, against what rule, and what happens when the answer is no.
Say it aloud to check your reading: a claim arrives, eligibility is checked, a decision splits on whether the amount is above the threshold, above-threshold claims go to a second approver, payment is issued, and the case ends either paid or rejected.
If you can say that sentence while pointing at the diagram, you've read it correctly. If you can't, the diagram is missing a label, not a reader.
Choosing a Notation for Your Purpose
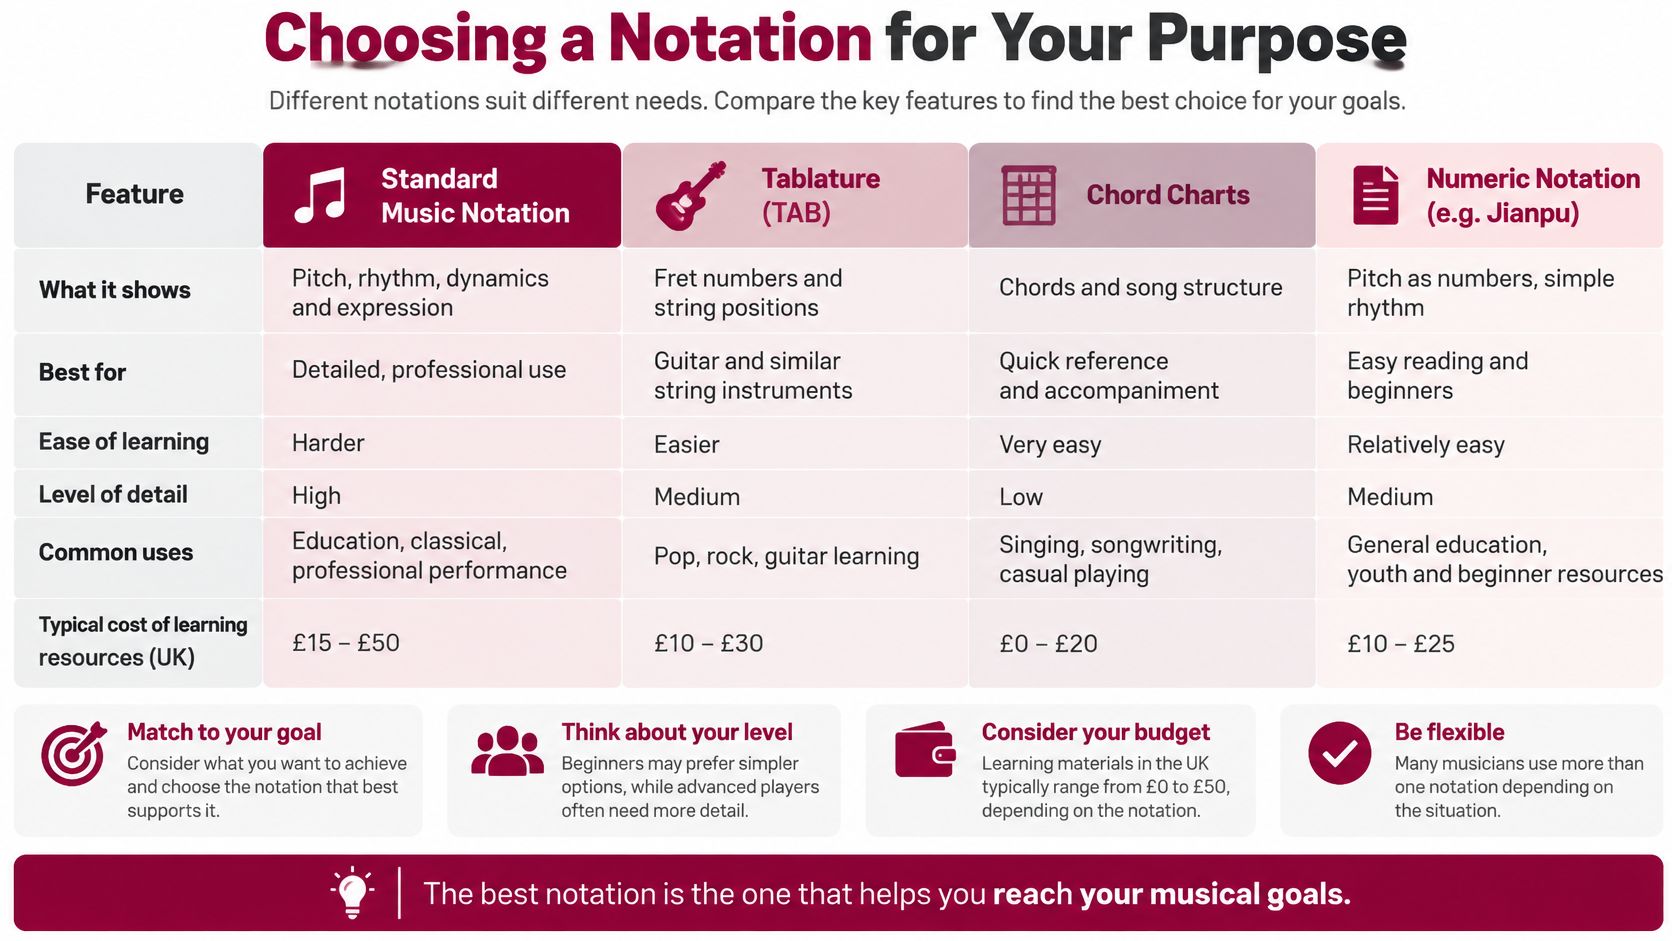
The verdict first: sketch with flowcharts, hand over with BPMN, and pick one notation and stay with it. The choice of language matters far less than consistency, because models drawn in different languages can't be compared, joined or governed together.
| Notation | Best for | Precision | Automation readiness | Learning curve |
|---|---|---|---|---|
| Flowchart | Quick current-state sketches | Low | Low | Low |
| BPMN 2.0 | Governance and handover to IT | High | High | Moderate |
| EPC | SAP-centred process landscapes | Medium to high | Medium | Moderate |
| UML activity diagram | System and software design | High | Medium | Moderate to high |
Why BPMN wins for governance, and why that isn't the whole story
BPMN 2.0 carries more structure per activity than a flowchart, and that structure is what lets a model travel from a business conversation into a workflow engine without being redrawn from scratch. UK Digital Marketplace service specifications for process modelling describe the work as documenting existing people, processes and technology, then designing target processes aligned with organisational objectives, and they name BPMN among the recognised notations that improve clarity, standardisation, governance and automation readiness.
That matters because a model used for decisions has to carry an owner, an input, an output, a business rule, a system, a service-level target and an exception path for every activity. A flowchart can hold a few of those in a side note. BPMN holds them in the diagram itself, which is why it survives contact with an IT team.
Event-driven process chains appear when the process framework is built around a particular enterprise system, and their symbols are closely tied to that tooling. UML activity diagrams are designed for system and software behaviour, which makes them precise for engineers and awkward for a room full of operations staff.
Teams that want to see where a process loses value before choosing a language often start with a higher-level view of flow and waiting time; the value stream mapping lesson covers that approach and pairs naturally with a BPMN model drawn afterwards.
Whichever notation you settle on, write the house rules down: a naming convention, one owner per task, mandatory labels on every gateway exit, and a single place where the current version lives. Without those, the choice of notation is an academic argument.
How to Build a Business Process Model Step by Step
The Fraud Control Testing Framework from the UK Government defines business process mapping as a visual representation of a process that gives a top-down view of its architecture or design, showing the flow of materials and information, the tasks performed, the decisions made and the relationships between steps. That definition sets a sensible quality bar, because it asks for actors, timing and purpose alongside sequence.
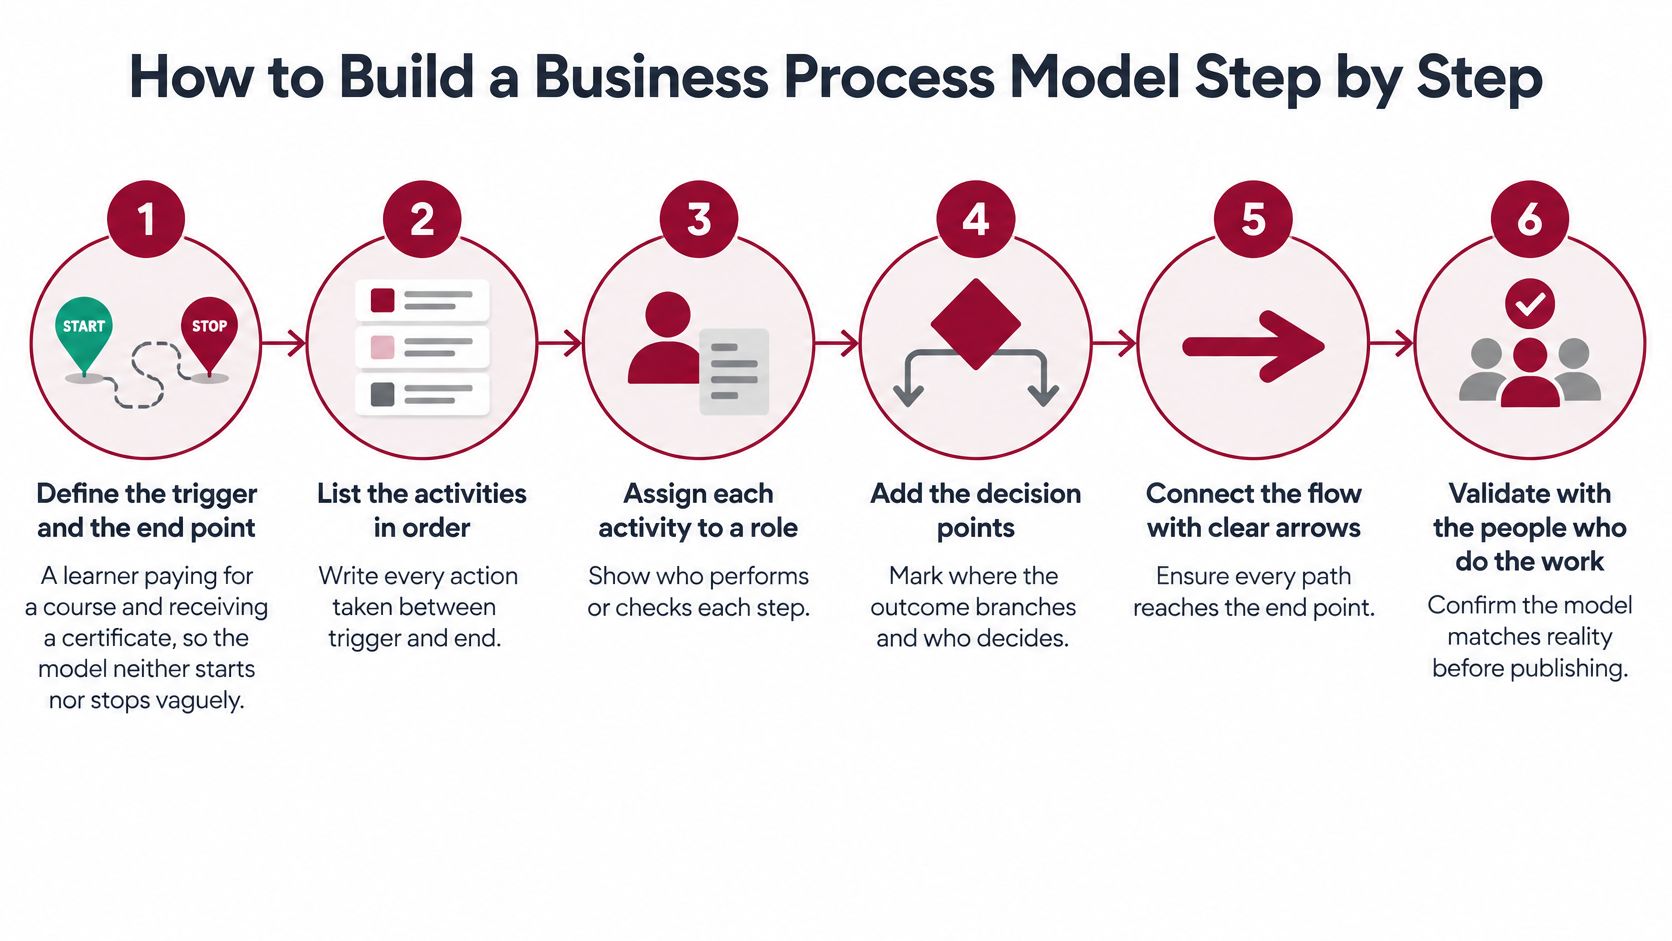
The routine
Fix the trigger and the end point. A learner paying for a course and then receiving a certificate is a clean pair of boundaries. Start too early and the model fills with upstream noise; stop too soon and it hides the stage where the customer feels the delay.
Give every actor a lane. Draw swimlanes for roles, not individuals. A lane called "finance officer" survives a resignation; a lane called "Priya" doesn't, and it turns a process document into a staffing chart.
Walk the process as it runs. Observe the work or interview the people doing it. Job descriptions describe intention, and the space between intention and practice is exactly where the queues live.
Sequence the tasks and put a gateway at every decision. Include the exception paths, such as a failed payment or an identity check that doesn't return a result. If a case can go sideways, the model should show where it goes and who catches it.
Answer four questions for each task. The framework's four are: what triggers the task and what follows it, who performs it, when it happens, and why the step exists. A task that fails the fourth question is a candidate for deletion, and finding those is often the fastest saving a first model produces.
Attach the attributes that make it usable. That means an input, an output, a business rule, the supporting system, a service-level target and a named owner. These are what separate a decision tool from a drawing.
Validate with the people who run it, then time it. Compare the claimed durations with observed cases. If the model says four days and real cases take nine, either the model or the process is wrong, and you need to know which before you change anything.
The framework adds one further technique worth borrowing even outside a fraud context: pair the map with personas of the people most likely to exploit it, mark the points where the process is vulnerable, and place the mitigation where it bites. Risk controls land better when they sit on a specific step rather than in a policy document.
The check before you publish
Three conditions settle whether a draft is readable. There is one start. Every path reaches an end. Every gateway has labelled outgoing flows. Fail any of them and the diagram will be misread, usually by the person whose approval you need.
Worked Examples From Public Statistics to Enrolment
The UK's Office for National Statistics doesn't treat process modelling as a drawing exercise. It uses the Generic Statistical Business Process Model (GSBPM) as the foundation for producing official economic and population statistics, and the model covers the full lifecycle: identifying needs, designing the approach, building systems and methods, collecting data, processing and analysing it, disseminating results and evaluating outcomes. In its economic-statistics transformation programme, the ONS states that the GSBPM underpins production across the end-to-end process, covering 74 surveys that supply data for outputs including monthly GDP, business prices and average weekly earnings, as set out in the plan for ONS economic statistics.
What makes the ONS case instructive is scale. Seventy-four surveys feeding a handful of published series means data collection, technology, specialist staff, quality controls and publication all have to be coordinated, and a shared model gives those teams a common structure instead of a set of private habits.
The same discipline at enrolment scale
A training provider's enrolment journey fits the same shape. Draw it as a swimlane with lanes for the learner, the platform, the finance provider, academic operations and certificate verification, and the model immediately shows the stages where work changes hands.
The framing comes from GOV.UK's guidance on mapping a user's whole problem, which recommends covering online and offline touchpoints, back-end processes, participating roles and the evidence users must provide, then using the map to identify where users struggle. The same guidance asks teams to design around user needs rather than a preselected technology, which is the argument for testing a process model with learners before automating any part of it.
Three gateways carry most of the risk in that journey: payment success, assessment completion, and enrolment exceptions such as a mismatch between the name on a payment and the name on a certificate. Each deserves a labelled exit and a named owner.
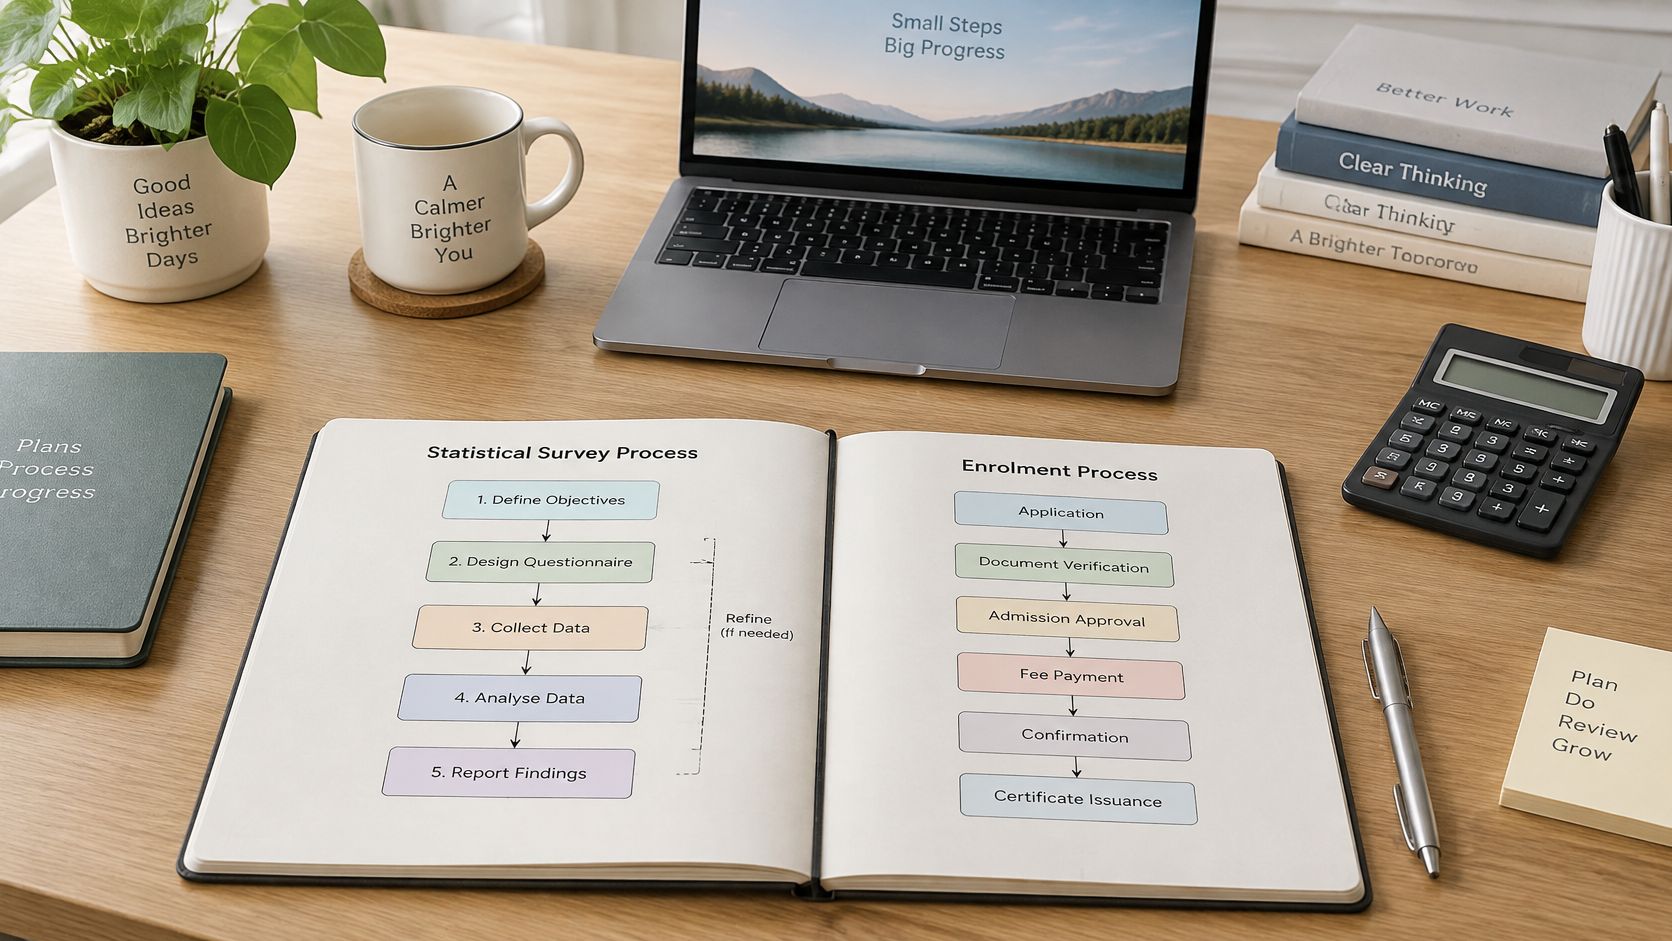
Mapping the learner's side of the same journey is the natural companion exercise, and a worked customer experience mapping example shows how the customer-facing view sits alongside the internal swimlane. Our own learning model combines interactive coursework, real-world examples and case studies, so learners can practise the mapping on a realistic case rather than an invented one.
Both examples share the same two habits. Every stage has an owner, and every point where work changes hands is marked.
Using Models to Find Bottlenecks Before Automating
A model that has been drawn, signed off and filed has produced nothing. It earns its place when it shows where work waits, stalls or loops back, and when those findings change a decision about staffing, sequencing or software.
The five measures that turn a diagram into evidence
| Measure | What it reveals | Example reading |
|---|---|---|
| Elapsed time per case | Total wait from start to finish | 9 days from request to refund |
| Queue time | Waiting before work starts | 3 days in an approval queue |
| Hand-off count | Transfers between roles | 6 hand-offs per case |
| Rework rate | Share of cases returned for correction | 15% of claims sent back |
| Cost per completed case | Staff and system cost per outcome | Compare before and after redesign |
Read the examples together and the pattern appears. Nine days from request to refund means little on its own; split into working time and queue time, it may show that six of those days are spent waiting for an approval that takes four minutes to give. A rework rate of 15% means roughly one case in seven is paid for twice. Six hand-offs mean six chances for a document to be asked for again. For a worked view of how these numbers connect to wider operating decisions, see how operations management drives efficiency and productivity.
What the UK evidence says about automation timing
UK government research on AI adoption in business found that 16% of UK businesses reported using at least one AI technology, while 80% were neither using AI nor planning to adopt it. Among those already using AI, 47% identified automation as a use case. Yet in the professional and business services analysis, 70% reported limited progress on process redesign, and three-quarters weren't ready on core enablers such as data, orchestration and monitoring.
That gap is the practical argument for mapping before buying. The ONS management practices survey points the same way: the average management-practice score for UK firms rose from 0.49 in 2020 to 0.55 in 2023 on a scale from 0 to 1, and businesses scoring below the median were four times more likely to use little or no analysis of their operations. Firms that measure their work are the ones equipped to improve it.
The sequencing rule: redesign first, automate second. Automating a process you don't understand gives you the same defects at higher speed, with the defects now embedded in software that's harder to change.
The order that works
Name the process owner before anything else, because someone has to accept the findings. Collect exception and rework data, since that's where the recoverable time hides. Define the service-level and risk measures the process should meet. Separate rules-based activities from those needing judgement, because only the first group is a serious automation candidate. Test the redesigned process as a paper exercise with real cases. Then, and only then, choose the tooling.
Early on, a rough current-state map drawn with the team in an hour beats a detailed BPMN model drawn alone in a week. When people in the room disagree about what happens, agreement is the deliverable, and precision can wait.
Map One Process This Week
Pick one process with an obvious start and finish: a refund request, a new starter's first week, a supplier invoice. Draw the current state using the symbol key, attach the five elements to each activity, and record three numbers as you go, namely elapsed time, queue time and hand-off count.
Then take the draft to the people who run the process and read it back step by step. Ask them to correct it. A rough model checked against reality is worth more than a polished one nobody has tested.
Walk-through checklist
- Trigger: confirm the event that starts the process, not the one that's convenient to draw.
- Hand-offs: name the role that receives each one, and what it must receive to continue.
- Timings: check against three or four real cases rather than anyone's recollection of a typical week.
For readers who want structured practice, our Operations and Process Management course is one option among several. It's accredited by the CPD Certification Service, delivered online and self-paced with a recommended minimum of 20 hours, and costs £99.00 excluding VAT. Process design, capacity and quality management, lean operations and performance measurement all sit inside it, which gives the mapping work a wider frame than a single diagram.
Then return to the test. For every step in your model, can you name the owner, the input, the output, the business rule and the metric? If you can, the model is ready to support a decision rather than decorate a meeting.
London School of Business Administration is a UK-based education provider whose business and management programmes are built around real-world examples and case studies, the same approach this guide has used to work through refunds and enrolment journeys. Its self-paced, CPD-accredited courses cover operations and process management, quality and performance measurement, and the wider management disciplines that make a process model useful rather than decorative. Visit London School of Business Administration to see how the programmes fit together and where process skills sit within them.