


You've got a product idea, a course outline, or a new service offer, and the hard question is already on the table, will anyone in the UK want it? That's the point where many owners, managers, and tutors start guessing from their own experience, or from a few polite conversations with contacts. Good market research replaces that guesswork with evidence you can defend, question by question, before you commit money, time, and reputation.
A well-run research process is not a fancy survey for its own sake. It is a decision tool that helps you decide whether to launch, revise, segment, price, or stop. In a UK setting, that matters even more because the business population is not a neat classroom example, it is dominated by small firms and a very large share of non-employing businesses (UK business population guidance).
Table of Contents
- What Market Research Actually Does for a UK Business
- Defining the Research Question and Target Population
- Building on UK Secondary Data Before Collecting Anything New
- Choosing Primary Methods That Fit a UK Decision
- Sampling, Piloting, and Weighting the UK Way
- Analysis That Turns Raw Data into Defensible Findings
- Reporting Templates and Common UK Research Questions
What Market Research Actually Does for a UK Business
A new offer often starts with a familiar situation. Someone in a small firm, a college team, or a training provider thinks the idea makes sense because a few clients have asked for it, competitors appear to be doing well, or the internal team feels the timing is right. That instinct can point you in a useful direction. It is not evidence yet.
Research turns opinion into a documented decision
Proper market research does more than tell you whether people like an idea. It helps you define who the market is, what problem you think you are solving, how strong demand looks, and what evidence would justify action. In practice, that means moving from exploratory research to descriptive research, then to causal research. A useful example is exploratory interviews with Midlands training managers to surface objections, a descriptive survey to measure interest by size band, and then a causal price test before launch.
A good UK process also leaves a paper trail. You should be able to explain who was eligible, how people were chosen, what you asked, how you handled bias, and how much confidence you have in the result. That is what makes findings defensible when someone later asks why you launched, delayed, or declined a project.
Practical rule: if the research cannot show who it represents, it cannot safely support a serious business decision.
The UK angle matters because a generic textbook sample can miss the market structure. If you recruit only from visible firms, social followers, or volunteers, you may under-represent microbusinesses, newly formed businesses, and firms outside employer registers. For a clear framing of why market opportunity analysis starts with the market itself, see understanding market trends and identifying opportunities.
Defining the Research Question and Target Population
Before you write a questionnaire, write the decision. A question such as “Should we launch a leadership credential for first-line managers in the Midlands?” is still too broad to test properly. Turn it into a measurable objective, such as whether managers in a defined UK region show enough interest, willingness to pay, and delivery preference to justify a pilot.
Start with a decision, not a topic
The first task is to define the research question in operational terms. State the decision you need to make, the audience you care about, the indicators you will measure, and the minimum level of evidence that would change your mind. If the result will affect pricing, include price sensitivity. If it will affect delivery format, include preferred study mode, timing, and support needs.
Then define the target population precisely. In UK business research, that usually means naming the nation or region, business size band, sector, and, where relevant, employment status. The reason is simple, the UK business population is heavily skewed towards smaller organisations, and the Department for Business and Trade's 2024 estimates show that SMEs represented 99.8% of the total business population, with 5.45 million small businesses, 37,800 medium-sized businesses, and 8,250 large businesses (Business Population Estimates 2024 methodology note).
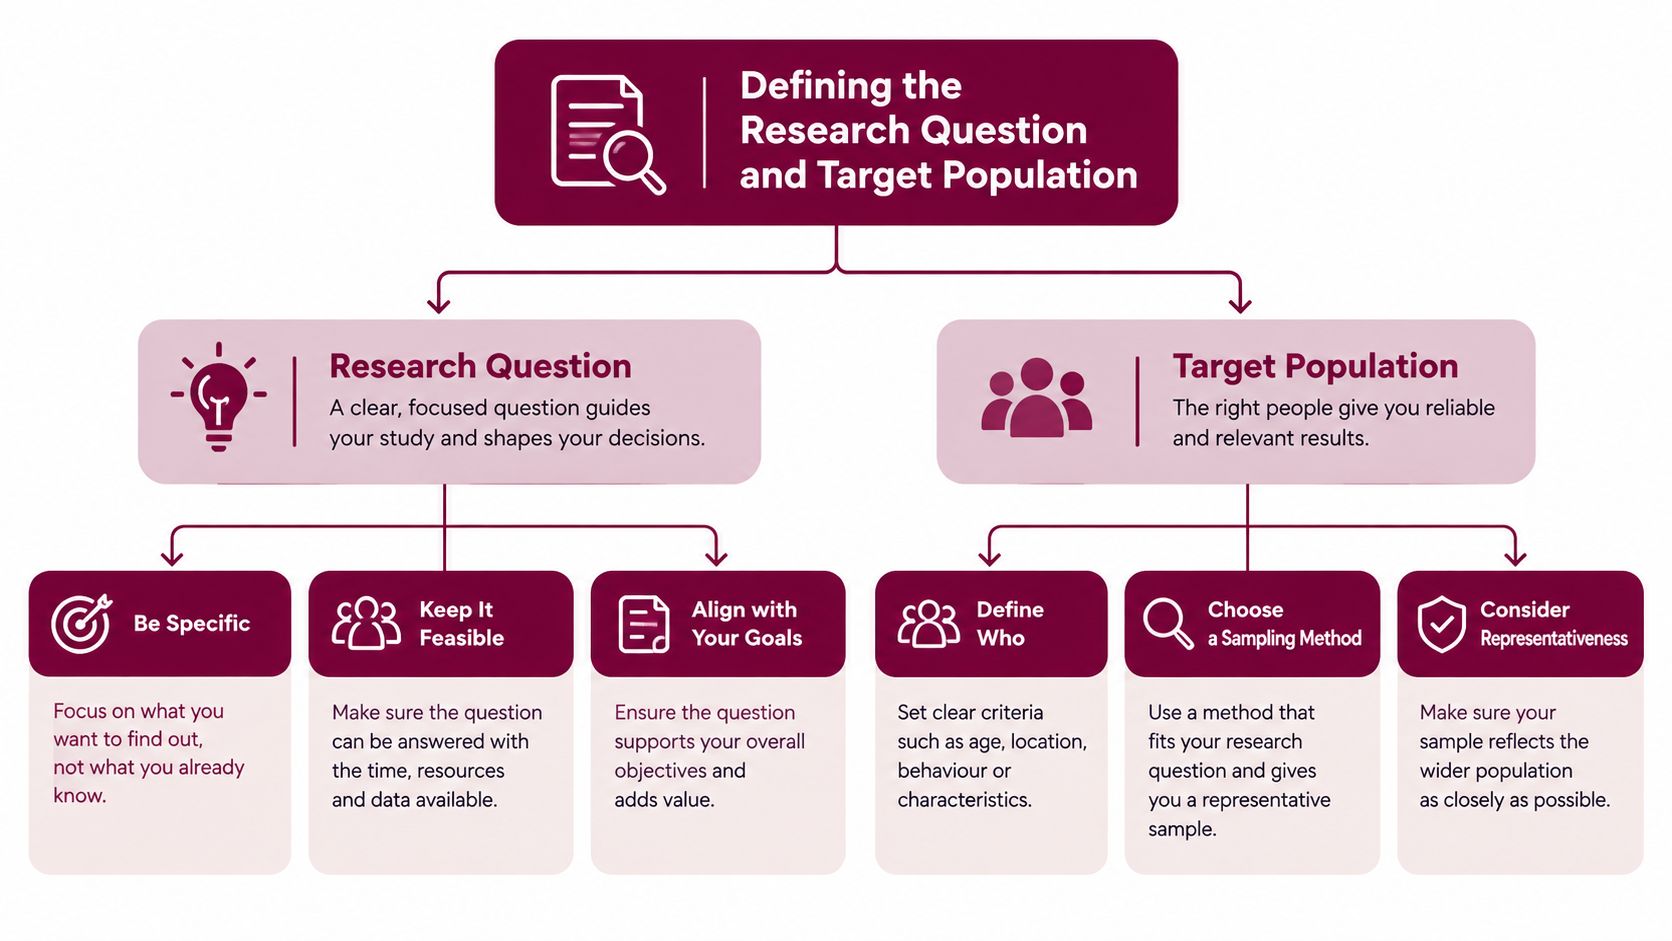
A one-page brief is enough if it is tight. It should name the decision, the population, the indicators, the inclusion criteria, and the evidence threshold. If you cannot write that page clearly, the research design is not ready.
A vague audience definition usually creates vague findings. The fix is not more questions, it is a sharper population.
If you're framing learning demand rather than B2B demand, the same discipline applies. A course aimed at new managers in the Midlands is not the same as one aimed at entrepreneurs, senior leaders, or general business learners. The sample has to match the decision, not the convenience of recruitment.
For readers building consumer-led segmentation work, the logic in this article on consumer behaviour and adapting to changing customer needs is useful for sharpening the audience definition before fieldwork begins.
Building on UK Secondary Data Before Collecting Anything New
Secondary research is where disciplined projects begin. The first move is usually not a survey, but a careful review of official UK sources that help you size the market, define the frame, and spot obvious mismatches before you spend time on primary research. That means the ONS business register, Business Population Estimates, labour-market releases, and relevant Department for Business and Trade publications.
Use the right official frame for the question
The Inter-Departmental Business Register is the UK government's main sampling frame for business surveys run by the ONS and other departments, and the official methodology for it explains how that register supports business population and demography work (Inter-Departmental Business Register methodology). The point is practical. The frame you choose decides who can appear in your sample. A sample drawn only from visible firms or volunteers can miss owner-only businesses and newly established firms.
You also need to separate counts that sound similar but are not interchangeable. The Business Population Estimates describe the wider private-sector business population, while ONS administrative counts cover businesses registered for VAT and/or PAYE. In March 2024, ONS recorded 2.725 million UK businesses registered for VAT and/or PAYE, which is a different population from the broader private-sector total (Business Population Estimates 2024). If a report does not say which population it uses, the numbers are too loose to trust.
A useful desk-research audit is straightforward:
- Record the dataset name: write down the official title exactly as published.
- Note the reference date: distinguish start-of-year estimates from administrative counts.
- Check the coverage: say whether the source covers all private-sector businesses or only registered ones.
- Carry uncertainty forward: if the source reports a confidence interval, keep it in your interpretation.
- Compare like with like: do not compare a nationwide estimate with a regional or registration-only count.
The main habit to build is discipline around definitions. A figure is only useful if you know what it covers, when it was measured, and what was left out.
If two official sources appear to disagree, they are often measuring different universes.
For market sizing, this habit prevents avoidable mistakes. If your target is business customers, the relevant population may shrink once you exclude sectors, sizes, or non-buying entities. If your target is individual learners, the same logic applies through age, job role, region, and experience level.
Choosing Primary Methods That Fit a UK Decision
Once you know what you're trying to prove, choose the method that fits the decision. A survey is useful when you need patterns across a defined population. Interviews are better when you need language, barriers, and the reasons behind behaviour. Focus groups work when you want people to react to ideas together, while observation is useful when stated opinion and real behaviour may differ.
Match method to purpose
A structured survey is the right choice when you need measurement at scale. It helps you estimate interest, compare subgroups, and test whether results differ by region, seniority, sector, or business size. A semi-structured interview is better when the language of the market is unclear, because it lets respondents explain how they think about the problem in their own words.
Focus groups are useful when reactions are shaped by discussion, disagreement, or social comparison. Observational methods help when behaviour matters more than what people say about behaviour. For a pricing or landing-page test, a small behavioural experiment is often stronger than asking people what they might do, because it captures actual choice rather than polite intention.
If the topic is sensitive or unfamiliar, start with interviews and then move into a survey. If the topic is already well defined, go straight to structured measurement. A mixed design is often strongest, for example, fifteen to twenty-five interviews to surface the language of the market, followed by a stratified survey to test how widely those themes hold.
A useful check is whether your method can support the decision you need to make. If you need to know whether a new course should launch, you may need both preference and behaviour. If you need to know why people hesitate, you probably need open conversation before you need numbers.
If you're formalising marketing capability as part of a wider study, Marketing Strategy is a course title in the publisher's catalogue, and the name itself signals the topic area without promising anything beyond its listed scope.
A strong project also treats questionnaire wording as part of the method, not an afterthought. Test terms that may mean different things to different people, especially if you are asking about “CPD”, “self-paced”, or a “leadership credential”. A short cognitive test with a few UK respondents can reveal where people interpret a phrase differently from the researcher.
Good method choice protects you from false confidence. The wrong method produces tidy numbers with weak meaning.
Sampling, Piloting, and Weighting the UK Way
Sampling is where many first projects go wrong. The issue is not just how many responses you collect, it is whether the people in your sample had a fair chance of being included. For consumer work, the Food and You 2 official statistics survey offers a clear model, with stratified random sampling of adults aged 16 or over in England, Wales, and Northern Ireland, drawn from the Royal Mail Postcode Address File and weighted to improve population representativeness (Food and You 2 methodology).
Build the sample around the population
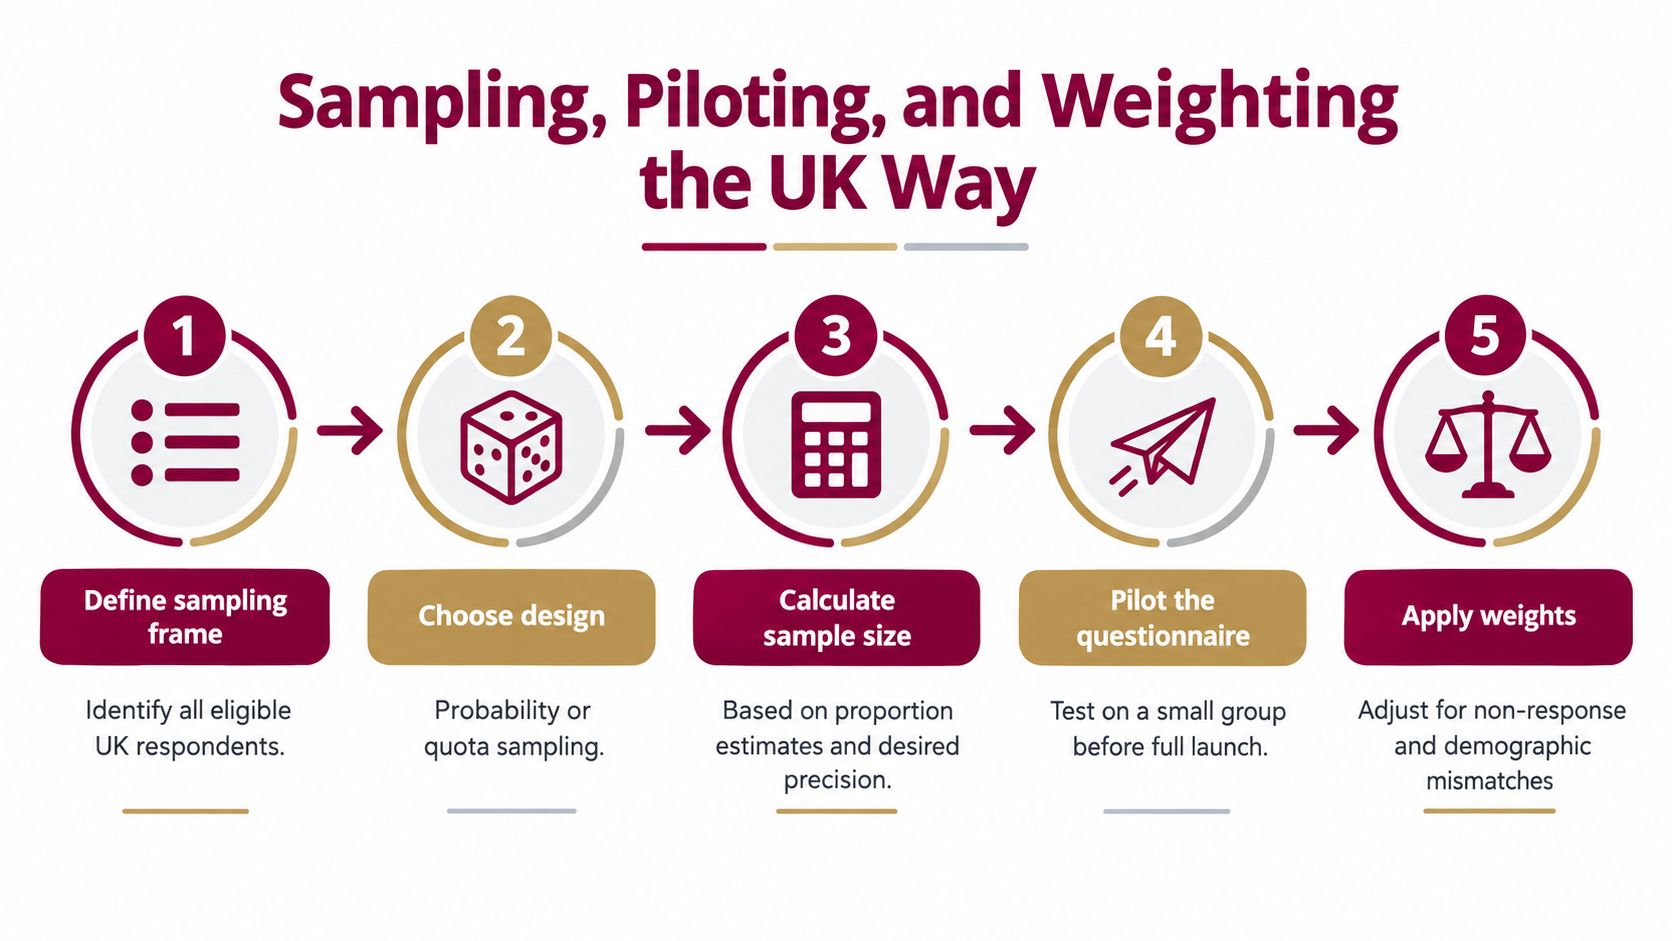
For business research, the sampling frame should come from an authoritative source such as the IDBR where possible, or another clear frame matched to the target. Stratify by the variables most likely to affect the decision, such as UK nation, region, sector, business size, and employment status. That way, a small but important subgroup does not disappear inside a larger one.
The UK business population makes this especially important. In 2025, 4.3 million UK private-sector businesses, or 75% of the total, had no employees other than their owners, while only 1.4 million had employees (Business Population Estimates 2025). A sample built only from employer databases would miss most of the population if the research question concerns all businesses, freelancers, or owner-managed firms.
Use probability sampling when you can. Use well-controlled quotas when a full probability design is not feasible, but be clear about the limits. A national proportion estimate often needs roughly 385 completed responses for a ±5 percentage-point margin of error at 95% confidence under simple random sampling, but subgroup analysis needs more, because each cell has to be large enough to support comparison (ONS methodology guidance).
Piloting is not a courtesy step. Test the questionnaire with a small UK group, remove double-barrelled or leading questions, and check whether the survey is too long or the response options are unclear. A short pilot often reveals where people read a term one way and the researcher means another.
Plan weighting before analysis begins, using known benchmarks where your achieved sample differs from the intended population. If you cannot explain how the sample was built, you cannot explain how much confidence the reader should place in the result.
Analysis That Turns Raw Data into Defensible Findings
Once the responses are in, the work is not finished. Raw data still contains missing values, inconsistent wording, partial completions, and open-text answers that need structure. Good analysis starts with cleaning, then moves to coding, comparison, and only then to interpretation.
Treat numbers and language with equal care
For quantitative data, clean the dataset first. Remove duplicates where appropriate, check impossible values, and decide how to handle incomplete responses. Then code the variables in a way that matches the decision, not just the spreadsheet. If you are testing course demand, for example, you may want to code by region, business size, seniority, and previous learning experience.
Use cross-tabulations to compare the results across pre-specified subgroups. That is where you can see whether interest is concentrated in one region, one age band, one business type, or one level of experience. If the pattern shifts when you control for other variables, basic regression can help separate a real segment effect from a confounder such as age, income, or prior training.
The ONS reminds researchers that coverage, non-response, response, imputation, and processing errors all matter, and that weighting and quality control help limit bias (ONS opinions and lifestyles methodology). That is a useful reminder that a clean-looking table is not the same as a trustworthy conclusion. When the results seem dramatic, check whether the subgroup is large enough to support the claim.
Qualitative analysis needs the same discipline. Build a coding frame, group recurring themes, and compare what people say in interviews with what they selected in the survey. If the qualitative and quantitative findings point in different directions, that difference is not a failure, it is a clue that the question, wording, or market segment may need revision.
For analysts and managers who want a wider view of how numbers and interpretation work together in business settings, this article on how data analytics is changing the business landscape gives useful context without replacing the need for rigorous research design.
The point of analysis is not to make the data look convincing. It is to show what the data can and cannot support.
A sound report should name the limits clearly. If a subgroup is small, say so. If a finding is suggestive rather than decisive, say that too. Credibility usually improves when the researcher is precise about uncertainty instead of pretending it does not exist.
Reporting Templates and Common UK Research Questions
A strong report makes the evidence easy to follow and difficult to misuse. A simple structure works well: executive summary, decision context, method, sample design, key findings with confidence intervals, limitations, and recommendations. Each part should do one job and avoid repeating the same message in different words.
A report structure you can reuse
Start with the decision. State what was being tested, who was surveyed or interviewed, and what evidence would have changed the decision. Then show the method clearly, including recruitment source, field dates, exclusions, and whether weighting was used.
Use the findings section to separate headline results from subgroup results. If confidence intervals are available, show them. If the sample is small or uneven, say so early. That protects the reader from over-reading a narrow result.
| Section | What it should answer |
|---|---|
| Executive summary | What matters most |
| Decision context | Why the research was done |
| Method | How evidence was gathered |
| Sample design | Who was included and how |
| Key findings | What the data shows |
| Limitations | What the data cannot prove |
| Recommendations | What to do next |
A few practical questions come up again and again. For a UK decision, there is no single universal minimum sample, because the right size depends on how precise the decision needs to be and whether you are comparing subgroups. Low response rates should be handled with transparency, not hidden, and response quality should be assessed against known benchmarks rather than assumed from the final count alone.
Desk research is enough when the decision is early-stage, the question is about context rather than intention, or official sources already answer the issue well. It is not enough when you need likely customer behaviour, willingness to pay, or evidence of demand from your actual audience. If you are checking export feasibility, add a barrier register for regulatory, customs, labelling, procurement, or data constraints before you call the market reachable.
A final checklist helps keep standards high: define the population, record the frame, state the sample design, show the weighting approach, separate findings from interpretation, and report the limits plainly.
If you want a more structured route into this kind of work, London School of Business Administration offers online business and management study that can support learners building practical research judgement alongside wider commercial skills. For a focused next step, visit London School of Business Administration and look at the programmes that fit your role, whether you're planning a launch, analysing demand, or sharpening your decision-making in UK business settings.