

A 23.9 percentage-point rise in online retail's share of Great Britain's spending separates May 2011 from May 2024, according to the Office for National Statistics retail sales bulletin. In July 2024, online sales accounted for 27.8% of total retail sales, while more than 70% took place in physical settings, as the ONS July 2024 retail sales bulletin reports.
This split gives a product marketing strategy two jobs: connect a defined offer to measurable demand, and gather evidence before committing substantial spend. The channel mix matters, but so does the order of decisions behind it.
Value sensitivity varies between customer groups. Research into those groups can show who may switch, who may wait, and who values speaking to a person rather than buying through a checkout. Short-term profit and sustained brand effects also need separate measures: one records immediate returns, the other tracks whether the product remains known and considered.
Discovery routes differ too. Some customers may start with an AI-generated answer; others may compare webpages themselves. Age alone does not determine a person's route, so test which sources and messages reach each segment rather than assuming one journey fits all.
Gather evidence in stages before increasing spend. Treat immediate profit and longer-term brand effects as distinct outcomes, and test discovery routes by segment.
Table of Contents
- A Six-Stage Product Marketing Framework
- Research the Market and Profile Customers
- Define Value Proposition and Positioning
- Allocate Channels Budget and Campaigns
- Set KPIs, Launch Checks and Working Set
A Six-Stage Product Marketing Framework
A six-stage plan turns market evidence into a controlled spending decision. Each stage leaves a practical record, so the team can check its reasoning before committing more budget.
Office for National Statistics analysis of aggregated, anonymised Visa data reports that online spending accounted for 50.5% of total UK card spending in September 2025, compared with 43.7% in September 2019. The same ONS Visa data shows online transaction spending per cardholder rose 16.7% over that period, while face-to-face spending rose 6.9%.
These figures support investment in mobile pages, search visibility, online payment and conversion work. Shops, events and employer conversations still carry weight alongside online channels. The task is to decide what evidence supports each investment, and what result would justify expanding it.
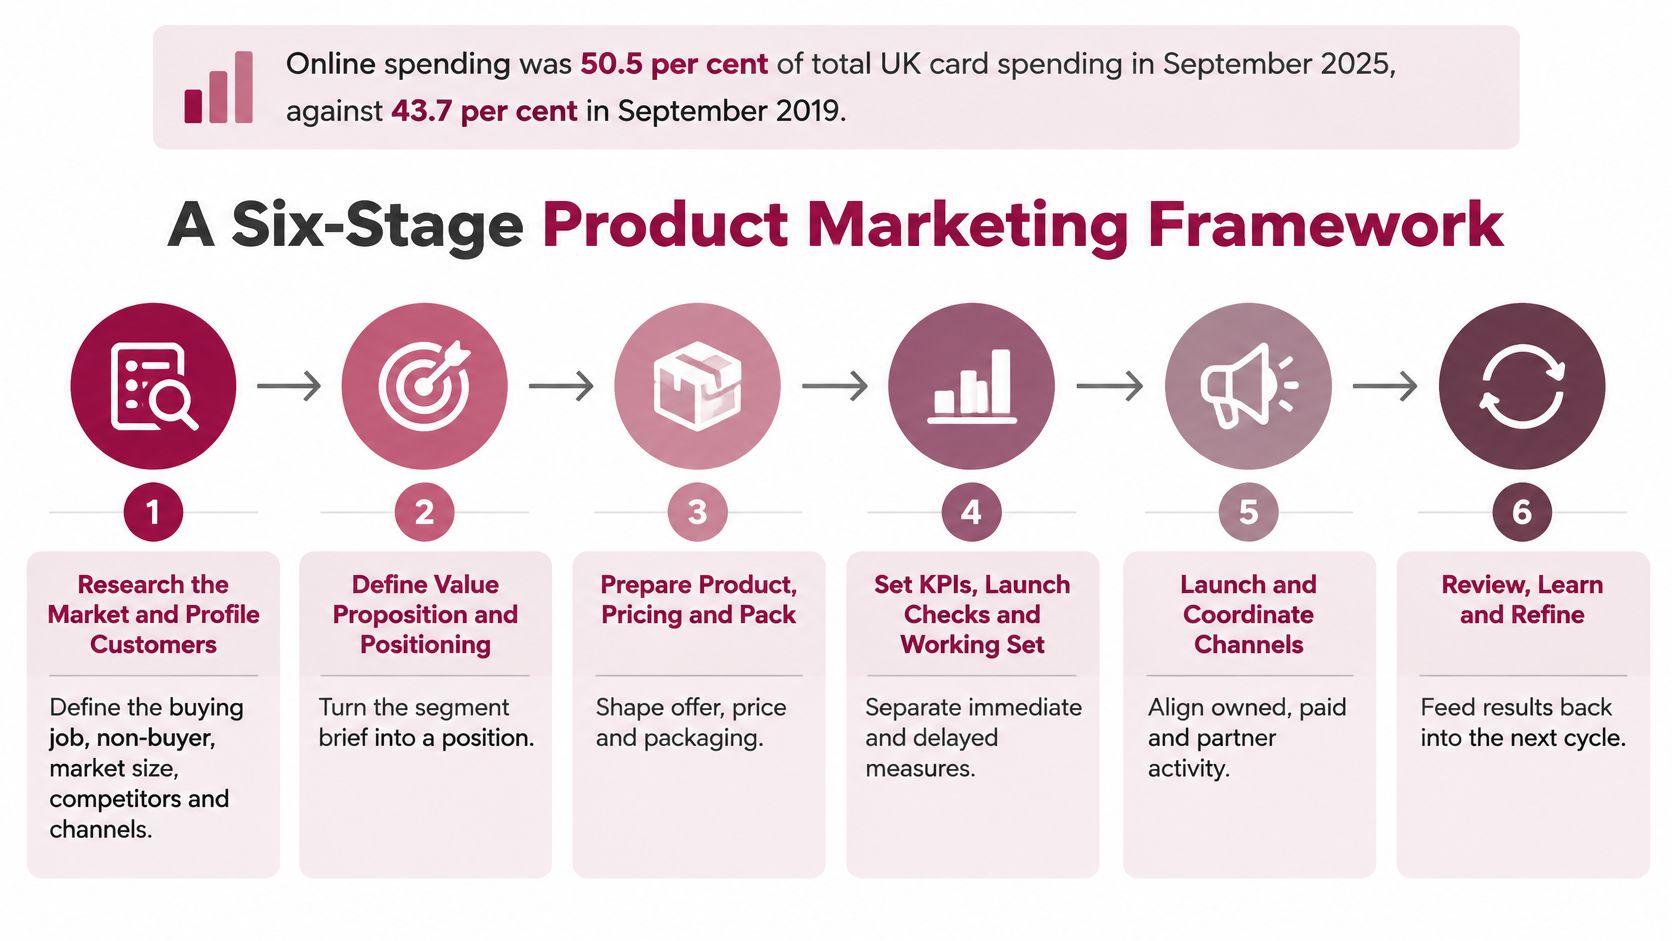
Six stages and the document each one leaves
| Stage | Decision | Output | Timebox |
|---|---|---|---|
| 1 Market evidence | Who has the problem and how large is it | Segment brief with constraints | 1-2 weeks |
| 2 Positioning | Why this product over alternatives | Value proposition and proof points | 3-5 days |
| 3 Channels | Where demand is created and captured | Channel matrix with one job per route | 1 week |
| 4 Budget | How spend splits between brand and activation | Adjusted allocation hypothesis | 2-3 days |
| 5 Measurement | What proves value beyond last click | Short-term and sustained KPI sheet | 2-3 days |
| 6 Launch gate | Whether to scale, revise or hold | Completed checklist and decision | 1-2 days |
Timeboxes and the calendar
A small team or early-career lead can prepare these six outputs in about four to six weeks. Larger organisations can use the same records while allowing more time for research. Treat the timebox as a prompt to make progress, not a promise that buyers will respond on schedule.
Online spending ratios tend to trough in December and peak in January. That seasonal pattern matters when setting targets: a January acquisition goal may not suit December. December can support awareness, gifting or lead generation; January may suit acquisition or renewal, including a self-paced course aligned with career planning.
Decision rule: Release budget to scale only when all six outputs are ready, even if a media account is already open.
Each stage builds on the last: evidence shapes the position, the position informs channel choices, and those choices guide the budget hypothesis. Measurement then separates immediate results from effects that take longer to appear. The launch gate uses both to decide whether to scale, revise or hold.
Research the Market and Profile Customers
Four in five UK consumers report concern about their finances, according to EY's research on consumers worried about money. That makes evidence about a product's intended buyers more useful than assumptions based on a national average. Gather it before shaping messages or committing media spend.
Four steps before any message is written
1. Name the buying job and the non-buyer. Record who feels the problem, who pays and who can block the purchase. If an offer serves several roles, keep separate notes for each. A career-switcher and a line manager may want the same course but have different reasons to hesitate.
2. Examine the problem within the intended segment. Record relevant characteristics such as age, income, category and region, then look for differences in price pressure and purchasing constraints. EY reports that 44% of UK consumers buy from discount retailers and 43% are switching to own-brand products. Use national findings as context, then check whether they apply to the buyers you are studying.
3. Map current behaviour. Record observed behaviour, such as search terms, comparison steps and checkout drop-off, rather than click counts alone. Include where people discover options, what they compare and what stops a purchase, including concerns about digital checkout. In its account of Google's UK consumer research, EY reports that 47% of Britons had tried a new brand, retailer or product in the previous six months, rising to 72% among Gen Z and Millennials. Treat switching as a pattern to investigate by segment, not as one national mood.
4. Write a one-page segment brief. Summarise the problem, evidence of switching and the constraints that affect a decision. A colleague who has not taken part in the research should be able to identify both the intended buyer and the non-buyer. For guidance on interviews and sample design, see this guide to conducting market research.
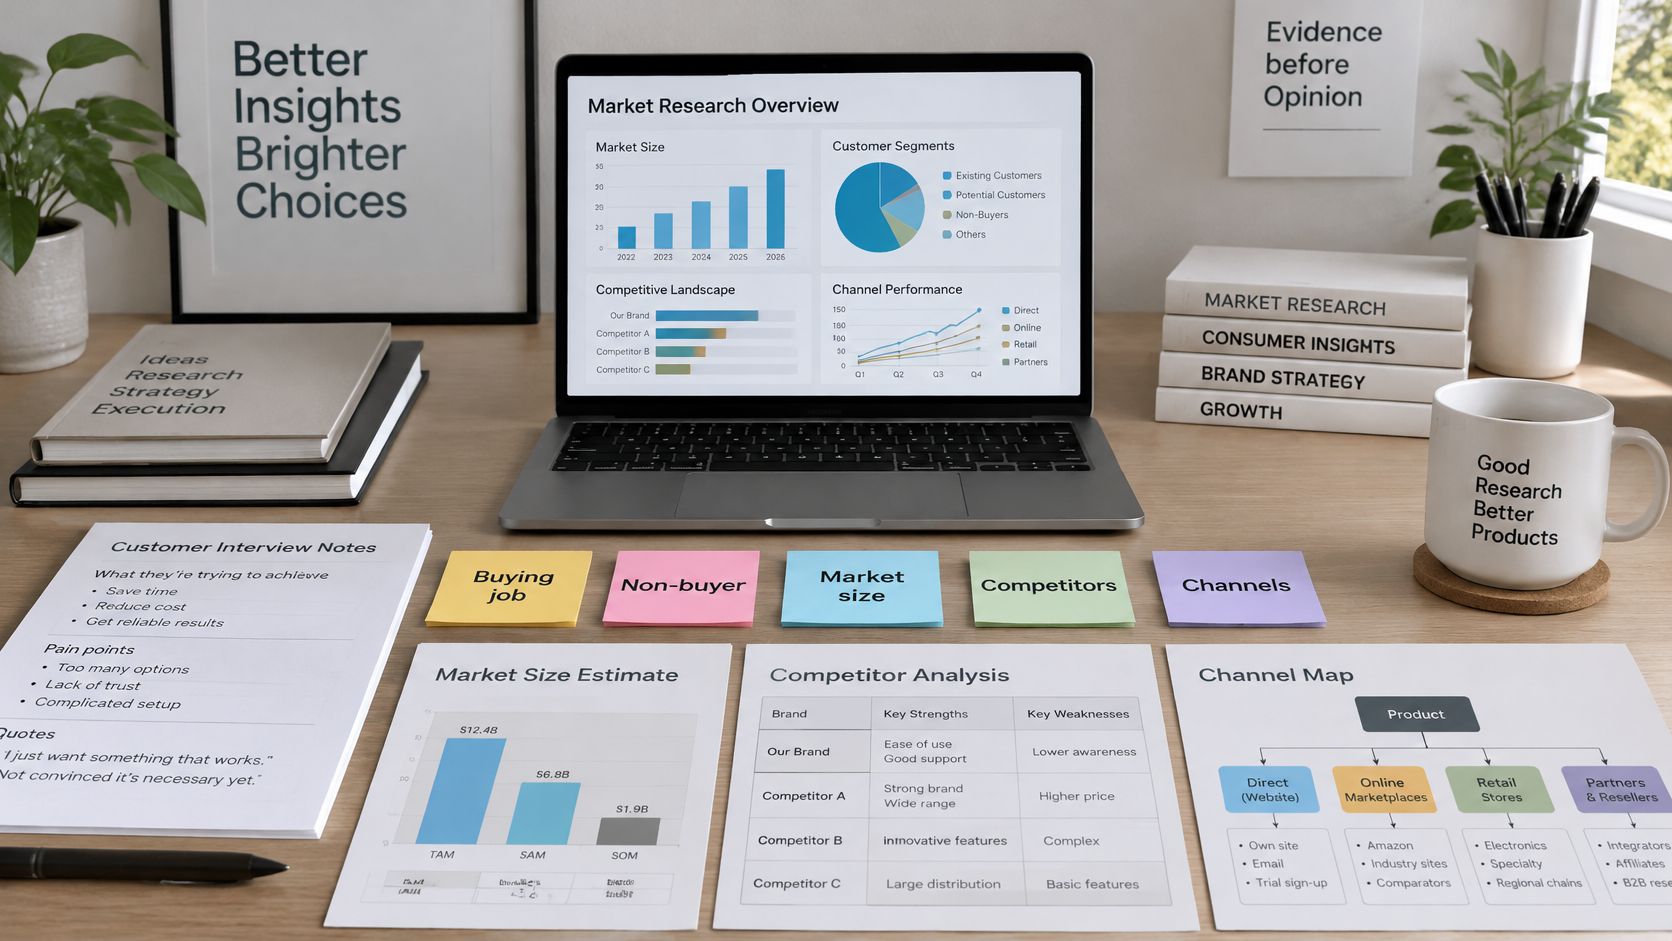
A course brief that splits two buyers
Suppose interviews for a self-paced professional course reveal that career-switchers ask about timetable flexibility, while managers ask whether an employer will recognise the credential. These are separate decision constraints. The brief should record both and identify who the offer does not serve.
The segment brief is ready when a colleague who was not in the interviews can identify the non-buyer without guessing.
Research on consumer behaviour can help explain how people choose, delay or refuse a purchase. Keep the brief concise: a longer document can blur the differences between buyer groups and make a national average seem more relevant than it is.
Define Value Proposition and Positioning
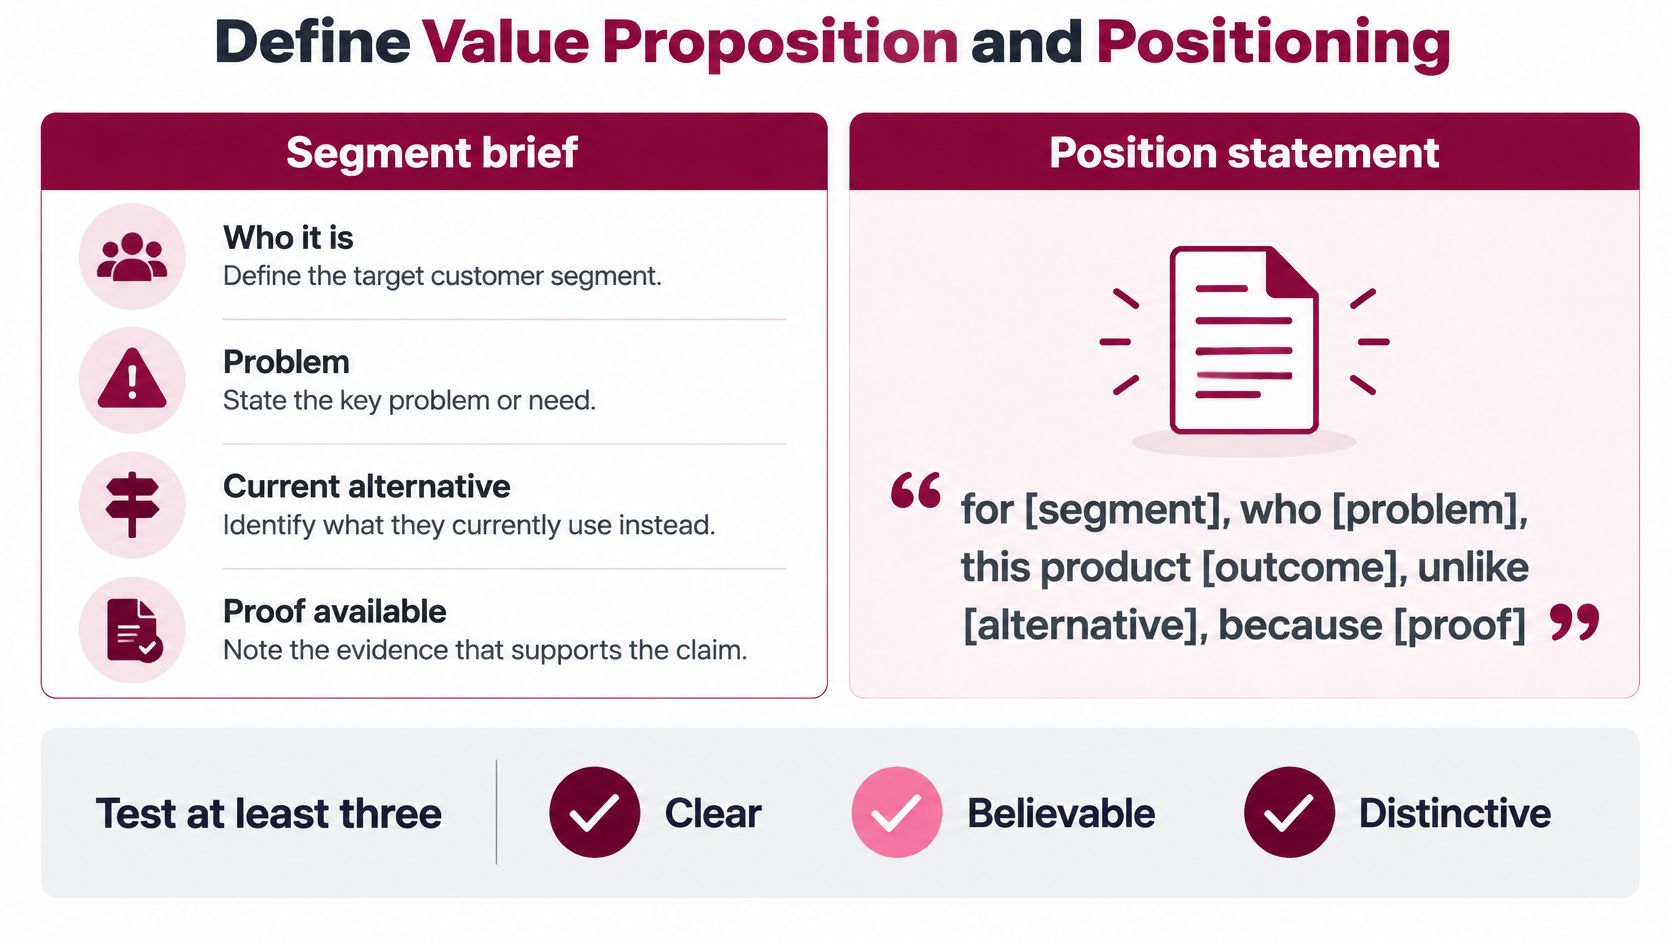
A value proposition connects a particular customer's need to a clear outcome and a reason to believe the claim. Write it before drafting advertisements:
For [segment], who [problem], this product [outcome], unlike [alternative], because [proof].
Each part has a job. The segment identifies who the offer serves; the problem and outcome explain its relevance; the alternative sets the frame for comparison; and the proof makes the promise credible. If any part is unclear, return to the segment brief rather than filling the gap with a list of features.
Test three lines on one audience
Compare three propositions with the same audience and the same landing-page experience. Keep the page layout fixed so the proposition is the main difference being tested.
- Lowest total cost. State the quality, service, delivery or learning outcome alongside the price. A discount alone gives buyers little reason to prefer the offer.
- Strongest functional outcome. Name the job the product helps someone complete, such as applying a skill at work within a stated period.
- Lowest perceived risk. For an intangible programme, explain its scope, assessment and expected study time. State accreditation accurately and show how a certificate can be checked, where relevant.
Positioning is a decision about the place a product should occupy in a buyer's mind, not a slogan. The Brand Management course explores that distinction. For further illustrations, see these branding strategy examples.
Two ways people now evaluate
Discovery and evaluation can involve different routes. In 2025, 37% of UK consumers under 40 reported using AI for at least half of their searches, compared with 16% of over-50s, while 18% typically went directly to a preferred brand's website, according to the 2025 UK Consumer Trends Report. The report also cites Deloitte's finding that 47% of people in the UK had knowingly and proactively used generative AI, as reported in the 2025 UK Consumer Trends Report.
Make the proposition clear across both AI-mediated discovery and conventional browsing, while allowing for variation within age groups. For AI-mediated discovery, present short, verifiable facts that an answer can repeat accurately: outcomes, assessment, price, accreditation and frequently asked questions. On a conventional page, give buyers the same information and a clear next step.
The same discipline applies to claims about automation. YouGov findings reported in the 2025 UK Consumer Trends Report show that 49% of UK SMEs not planning to adopt AI cited data privacy and security, while 19% cited ethics. Only claim automation the organisation can support in practice.
After comparing the three propositions, select the line that best connects the customer's need, the product's outcome and credible proof. For the course example, a tested line might read:
For career-switchers who need timetable flexibility, this self-paced programme develops a named workplace skill through a stated number of hours of study, with its syllabus, assessment and certificate-checking process published clearly.
Use the chosen sentence consistently across channels. Changing its promise in social copy creates a different proposition, one that needs its own evaluation.
Allocate Channels Budget and Campaigns
A 60:40 split between long-term brand building and short-term activation offers a starting point for planning. Adjust it to fit the buying cycle, margin and stage of testing, then measure returns against the agreed objectives.
Budget split by product situation
| Situation | Brand share | Activation share | Rationale |
|---|---|---|---|
| Default planning hypothesis | 60% | 40% | Build memory while supporting near-term sales |
| Short cycle and thin margin | 40% | 60% | Prioritise activity that can repay quickly |
| Long consideration or intangible offer | 70% | 30% | Allow more room to build trust and future demand |
| Controlled launch test | 30% | 70% | Test incremental impact before scaling |
| Scale after thresholds are met | 60% | 40% | Increase brand investment once the evidence supports it |
Treat these shares as starting points. As evidence accumulates, adjust the balance to reflect the product's economics and the campaign's results.
One job per route
Search and the owned site capture existing demand. Make price, access or delivery details, and proof easy to find.
Social and partnerships help build memory among people who may not yet be considering a purchase. Social Media Marketing examines this reach role, alongside the need for a clear proposition.
Email and remarketing bring considered demand back into view. They work best as part of a wider plan that also reaches people who have not yet shown interest.
Offline or assisted routes, including events, retail and employer conversations, can support evaluation for consequential purchases.
Build activation as a test matrix. Keep the audience and offer constant, then vary one factor: creative angle, channel or call to action. Set thresholds in advance for qualified conversion, acquisition cost and contribution profit. Allow enough exposure for a result to be meaningful before stopping a variant that misses its threshold.
Last-click return on ad spend can over-credit branded search and retargeting. WARC's analysis of 1,537 effective advertising case studies reports median revenue ROI of 4.33:1 and median profit ROI of 2.5:1. These results offer context, while each product's returns need to be assessed against its own costs and objectives. Google's 2025 measurement analysis reports that a 1% increase in brand awareness was associated with a 0.4% short-term sales increase and a 0.6% long-term increase. The distinction matters: immediate profit and sustained brand effects operate on different timescales.
A quarterly split you can audit
Suppose the quarterly budget is £20,000 and the default split applies. Allocate £12,000 to brand reach and partnerships, and £8,000 to activation. Divide the activation budget across three variants at roughly £2,700 each, changing only the creative angle. Set the stop threshold for cost per qualified acquisition before spending begins. For a consequential purchase, reserve part of the brand budget for an assisted route, such as an employer event.
Three pitfalls can weaken the plan. Overspending on retargeting repeatedly reaches people already exposed to the campaign. Declaring a winner from a tiny sample risks choosing a variant that will not perform consistently. Cutting brand activity because it lacks immediate sales can also remove effects that take longer to appear.
Set KPIs, Launch Checks and Working Set
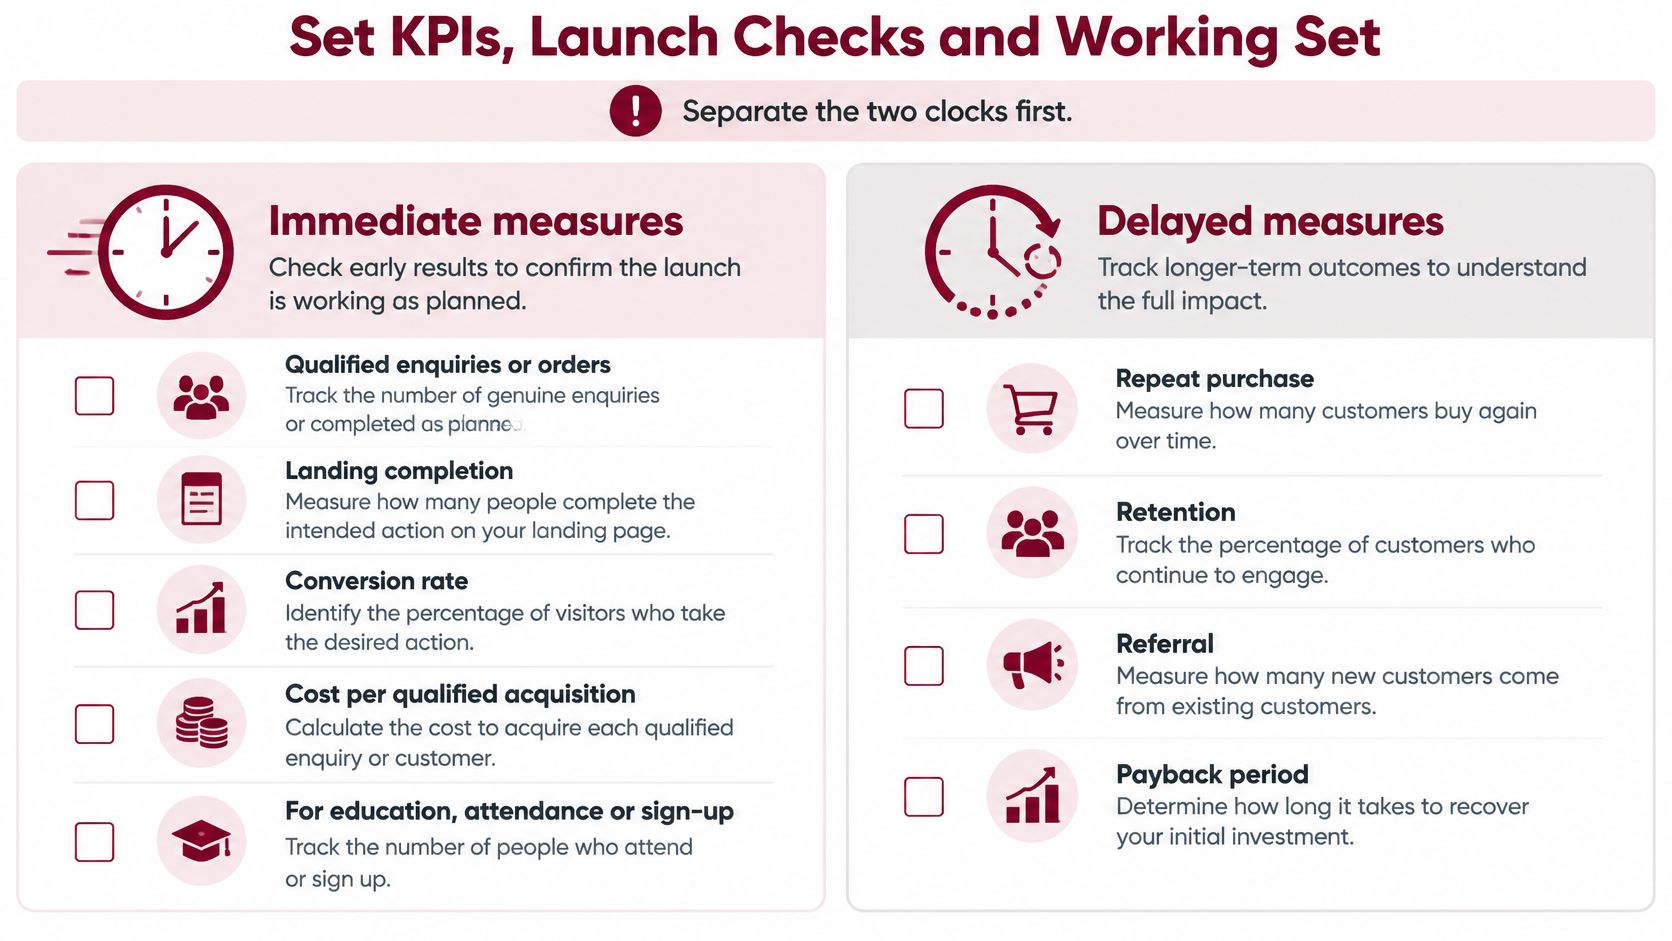
Weekly measures show whether current activity is on course. Quarterly measures help assess whether brand memory and customer fit are developing. Contribution connects both review periods to commercial value: reach without margin is not a result.
KPI timing and decision use
| Measure | Review clock | Decision use |
|---|---|---|
| Qualified enquiries or orders | Weekly | Check pacing and volume |
| Conversion rate and landing completion | Weekly | Identify creative and page fixes |
| Cost per qualified acquisition | Weekly | Apply the pre-set threshold |
| Enrolment rate for education offers | Weekly | Review the offer and price |
| Branded search and direct traffic | Quarterly | Track changes in brand demand |
| Assisted conversions and repeat consideration | Quarterly | Assess channel contribution |
| Retention, completion and referral | Quarterly | Evaluate product fit |
The UK Government's Online Advertising Taskforce progress report forecasts total UK advertising expenditure of £46 billion during 2025. In a market of that size, buying more impressions alone does not show whether a campaign is building lasting demand.
The IPA Effectiveness Databank's analysis of campaigns over more than two decades finds that advertising which significantly increases brand trust is highly effective at driving business and brand growth. For a course, trust depends on consistency: the website, advertising and emails should accurately describe what is included, how assessment works, and what a credential does and does not claim. This guide to analytics in marketing can help clarify how to assign an owner to each measure.
Nine checks, each pass or fail
- The segment brief is approved and reflects distinct customer groups, not one national average.
- One proposition was selected after the three-way test.
- Claims are consistent across channels and supported by evidence.
- The mobile journey, payment or enrolment, and next step are clear.
- Each channel has a defined role, and the budget split is recorded.
- Thresholds and a stop rule are set before spend.
- A named owner is responsible for short-term and delayed KPIs.
- December and January objectives are distinct if the plan spans both months.
- A revision route is agreed in case thresholds are missed.
Add a dated KPI review to the working plan, with an owner responsible for bringing the results and recommended changes.
The working set and the first action
Keep five pages together. The first is the segment brief, covering problem size, switching intent and constraints. The second records the chosen proposition and two alternatives considered. The third is the channel matrix, with one job for each route. The fourth shows the budget split as a hypothesis. The fifth holds the KPI sheet and checklist, including an owner and review date.
Set a 30-day window for reviewing activation variants, then assess branded search and retention quarterly. Before paid social begins, a founder can interview customers. A manager can align the proposition with finance around contribution rather than clicks. An early-career marketer can write the proposition and ask a senior colleague to test whether its evidence supports the claim. If launch checks fail, holding the launch is a valid decision.
The London School of Business Administration Marketing Strategy course covers setting objectives, identifying audiences, increasing brand awareness, selecting channels, implementing campaigns, measuring performance and evaluating outcomes. It costs £100.00 and is structured into eight chapters: Scenario, Targets, Reach, Awareness, Tactics, Execution, Generate and Yield. The school also offers Strategic Marketing for Startups.
London School of Business Administration provides self-paced, CPD-accredited courses and structured programmes, including study in marketing management. Its Marketing Strategy course gives learners a structured way to work through objectives, audiences, channel choices, campaign implementation and evaluation. Explore London School of Business Administration.